
How to track traffic from AI Overviews
Google counts clicks from AI Overviews as ordinary organic clicks, so no report hands you a separate AI Overview traffic number. Knowing how to track traffic from AI Overviews means you build that number yourself. You split your queries in Google Search Console into those that show an Overview and similar ones that don't, then compare their click-through rate (CTR). Branded search and assisted conversions then account for the visits that arrive later.
 Denys SuliatytskyiHead of Growth, Snoika · 8 min read

























Tracking AI Overviews traffic
To track AI Overviews traffic, measure the clicks you lose on queries that show an Overview and the demand that turns up later in other channels. On most informational queries, the Overviews do cut clicks. The Pew Research Center studied 68,879 Google searches made by 900 US adults in March 2025. Users clicked a traditional result in 8% of visits when an AI summary appeared, against 15% when none did. Ahrefs compared 300,000 keywords and found a 34.5% lower CTR for the top-ranking page when an Overview was present. A 2026 rerun with December 2025 data put the gap at up to 58%.
Elizabeth Reid, Head of Google Search, disputes those findings and says Overviews send "higher-quality clicks". Lily Ray, VP of SEO Strategy and Research at Amsive, answered: "I would love to see a single GSC report that confirms this statement, because every study so far has shown the opposite." Studies report averages across thousands of sites, so your own site's numbers are the only ones that settle the question for you.
You need four things before you start. Get full access to Search Console and editor access to Google Analytics 4 (GA4). Make sure your key events are already defined. Then build a query list where each query is flagged for whether an Overview appears on it. Snoika's onboarding asks for GA4 and Search Console access for the same reason. It also asks for Google Tag Manager access, since those accounts hold every signal this guide uses.
- Flag Overview queries and clean the Search Console data.
- Compare CTR on Overview queries against queries without one.
- Track branded demand on its own.
- Map assisted conversions in GA4.
- Split organic sessions from AI-influenced ones.
- Report monthly against a frozen baseline.
AI Overviews in Search Console
Search Console shows the impact of AI Overviews through query-level impressions and clicks. It also reports CTR and average position. You read them side by side for queries that trigger an Overview and for queries that don't. The comparison gives each group's results context.
Which metrics show the CTR impact
CTR is the main metric, and you read it against position. In the Performance report, filter Search type to Web. Then add a query filter (custom regex) that matches your Overview queries and export the results. Repeat the export for the control group. If CTR falls on the Overview group while the control group holds, the difference is the Overview's effect.
Google's documentation says an AI Overview occupies a single position, and every link inside it gets that same position. A page cited in an Overview can show position 1 with very few clicks. That's how the report counts positions, and it isn't an error.
What the generative AI report adds
Google launched a dedicated generative AI view in June 2026. It reports impressions from AI Overviews and AI Mode. Mintec, which works with the report, notes that it shows impressions by page only, without clicks or queries. The view is a filter over data that already sits in Web search, so never add its numbers to your Web totals. Use it to see which pages get cited, then go back to the main report for clicks.
Data errors to correct first
Google documented a logging error that inflated impressions from May 13, 2025 to April 27, 2026. The error left click counts intact, while CTR and position from that window are unreliable because both are calculated from impressions. Mark the window in your sheet, and check Google's data anomalies page before you call any drop a ranking change.
CTR shifts from AI Overviews
A CTR drop with flat impressions and a steady position means people still see your listing but fewer of them click. An AI Overview above your result has answered the question. At the same ranking, the listing now sits under an answer that satisfies part of the audience. Position matters here too. Amsive's study found a 27.04% CTR drop on Overview keywords ranking outside the top 3, because the Overview pushes those results further down the page.
| Pattern in Search Console | Likely cause | What to check |
|---|---|---|
| Impressions flat, position steady, CTR down | An Overview answers the query | Search the query on the same device and in the same country |
| Impressions down, CTR steady | Demand fell or rankings slipped | Seasonality and position history |
| Impressions up, CTR down, position steady | Inflated logging, or a new Overview citation | Anomaly dates and the generative AI view |
| Position down, CTR down | Lost ranking | Core update dates and competing pages |
| Branded CTR up on an Overview query | Your brand is cited in the answer | The generative AI view for that page |
Impressions flat, position steady, CTR down
- Likely cause
- An Overview answers the query
- What to check
- Search the query on the same device and in the same country
Impressions down, CTR steady
- Likely cause
- Demand fell or rankings slipped
- What to check
- Seasonality and position history
Impressions up, CTR down, position steady
- Likely cause
- Inflated logging, or a new Overview citation
- What to check
- Anomaly dates and the generative AI view
Position down, CTR down
- Likely cause
- Lost ranking
- What to check
- Core update dates and competing pages
Branded CTR up on an Overview query
- Likely cause
- Your brand is cited in the answer
- What to check
- The generative AI view for that page
Mobile and desktop show Overviews at different rates and with different layouts, so compare them separately. Before you attribute a drop to an Overview, confirm the Overview appears on that exact query today. Google adds Overviews to queries and removes them without notice.
Branded search as signal
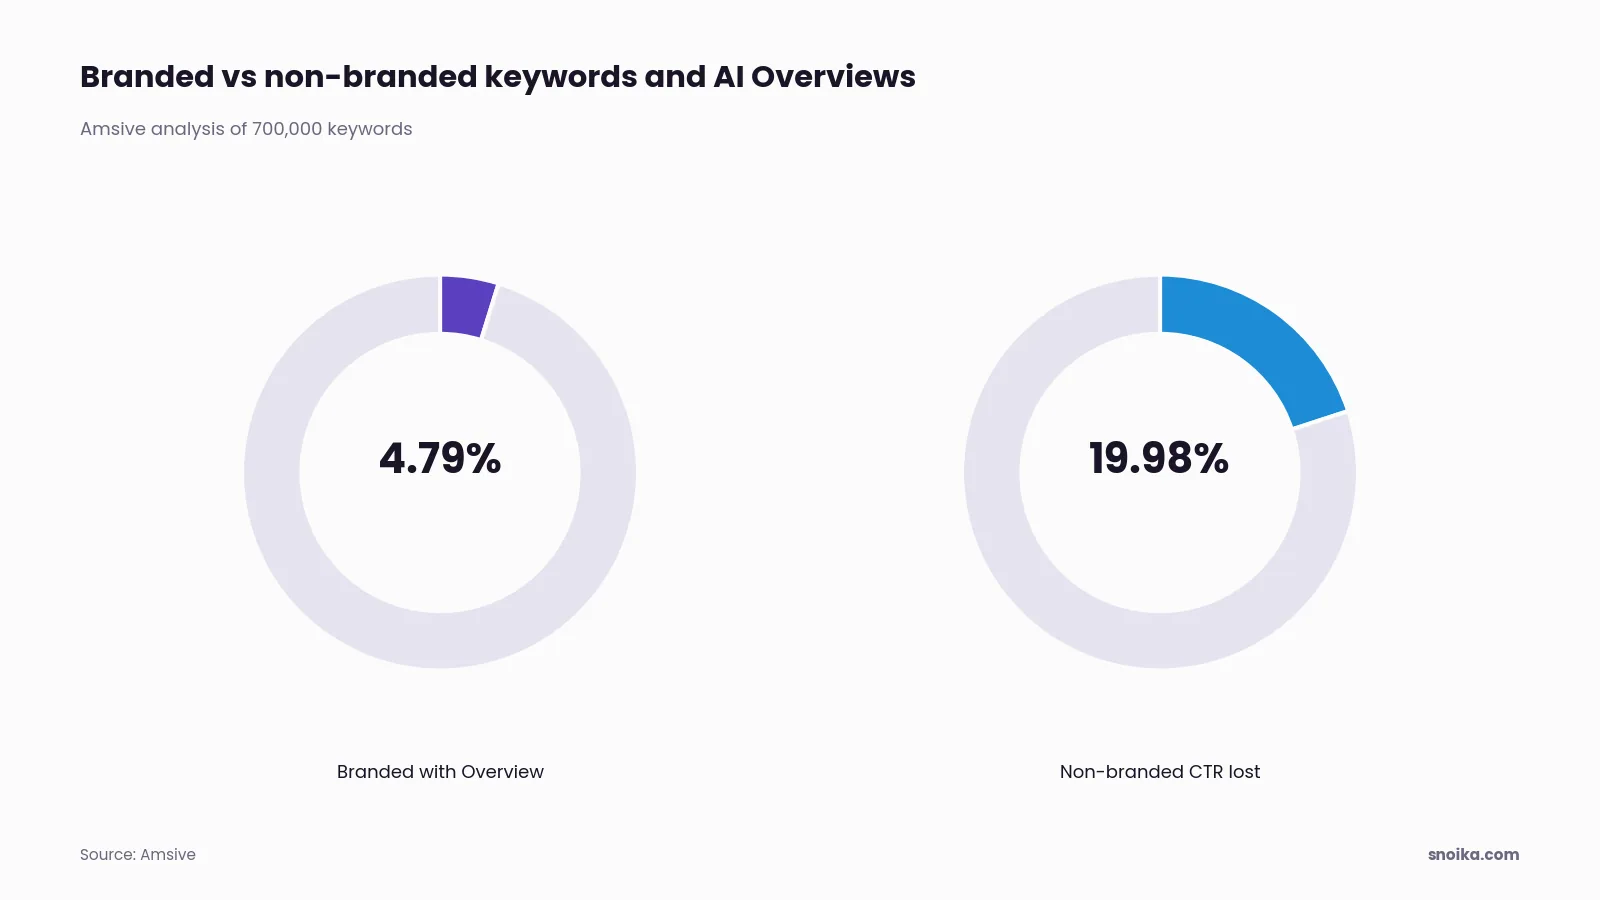
Branded search is the clearest signal of exposure that Overviews create without a click. A reader who sees your name in an answer searches for it later. Branded queries also rarely trigger Overviews. Amsive analyzed 700,000 keywords and found only 4.79% of branded keywords triggered one, while non-branded terms lost 19.98% of their CTR when an Overview appeared. That makes branded demand a clean thing to measure next to the non-branded queries that Overviews affect.
Build a regex filter in Search Console that covers your brand name and product names, with common misspellings of both. Then track branded impressions weekly. If non-branded clicks fall on Overview topics while branded impressions rise, the Overviews are sending people to you by name.
Campaigns and press coverage also lift branded search. Seasonal peaks affect that demand as well. So log every launch and media mention in the same sheet. A spike that lines up with a press story tells you about the story, and the AI Overviews had nothing to do with it.
Assisted conversions
To track assisted conversions from AI Overviews in GA4, look for conversion paths where an organic visit to an Overview-affected landing page comes before the session that converts. The landing page can be tagged, which is enough to follow the path.
- Build a landing page list from the pages that rank for your Overview queries. Turn it into a content group through Google Tag Manager, or keep it as a filter.
- Check that every conversion you care about is marked as a key event.
- In Advertising, open Attribution and select Conversion paths. Filter to paths where Organic Search is an early touchpoint.
- Compare the credit those pages get under data-driven attribution with the credit they get under last click. The difference is the assist value that last-click reports hide.
- Add a "How did you hear about us?" field to your forms, and store the answer in your CRM.
The lookback window under Admin, then Attribution settings, decides how far back GA4 looks for a first touch. Business-to-business buyers take longer than the window allows, so check it before you trust a short path. The form field matters most. 3DPrinterOS turned AI search into a steady source of 3–4 qualified inbound leads/day. A figure like that holds up only when the lead record states where the buyer first found you.
Organic vs AI-influenced sessions
Organic sessions are visits GA4 labels google / organic. AI-influenced sessions are the subset that lands on Overview-affected pages, plus visits referred by AI assistants. Clicks from an Overview arrive as plain Google organic traffic with nothing to mark them. So the landing page list from the previous section is how you separate the two.
Google Analytics made AI assistants easier to track by adding a default AI Assistant channel group for traffic from recognized chatbot referrers, such as ChatGPT and Gemini. Google also names Claude as an example. Before that change, teams built a custom channel group with a source regex and placed it above Referral. GA4 assigns each session to the first rule it matches. The ChatGPT mobile app sometimes strips the referrer, which sends those visits to Direct. Some ChatGPT links carry utm_source=chatgpt.com, so add that parameter to your filter.
With both segments built, compare engagement rate and conversion rate between them. Visitors who click through after reading a summary arrive further along in their decision. Fix your segment definitions once and don't change them, or each month's comparison will drift.
An AI impact report
An AI impact report is one page each month. It shows AI search ROI as what Overviews take in clicks and what they return in demand, measured the same way every time. A fixed layout lets readers compare this month with last month at a glance.
- Clicks and CTR on Overview queries against the control group
- Pages cited in the generative AI view
- Branded impressions, with campaigns noted
- Assisted conversions from Overview landing pages
- Sessions from the AI Assistant channel
- Brand mentions and citations inside AI answers
The last line needs a separate tool, because Search Console only covers Google. Snoika uses weekly prompt sets to measure mentions and share of voice in ChatGPT and Google AI Overviews, where most AI search traffic happens. These prompt sets also track sentiment and citations. A visibility percentage gives the exposure side of the report a number. Snoika's founder Anton Vedeshin reported to Startup Reporter 1StopVAT's move from 2.7% to 28.3% ChatGPT visibility in 16 weeks. Put a figure like that next to branded impressions from the same weeks, and readers can see whether rising AI visibility moved real search demand.
Before vs after benchmarks
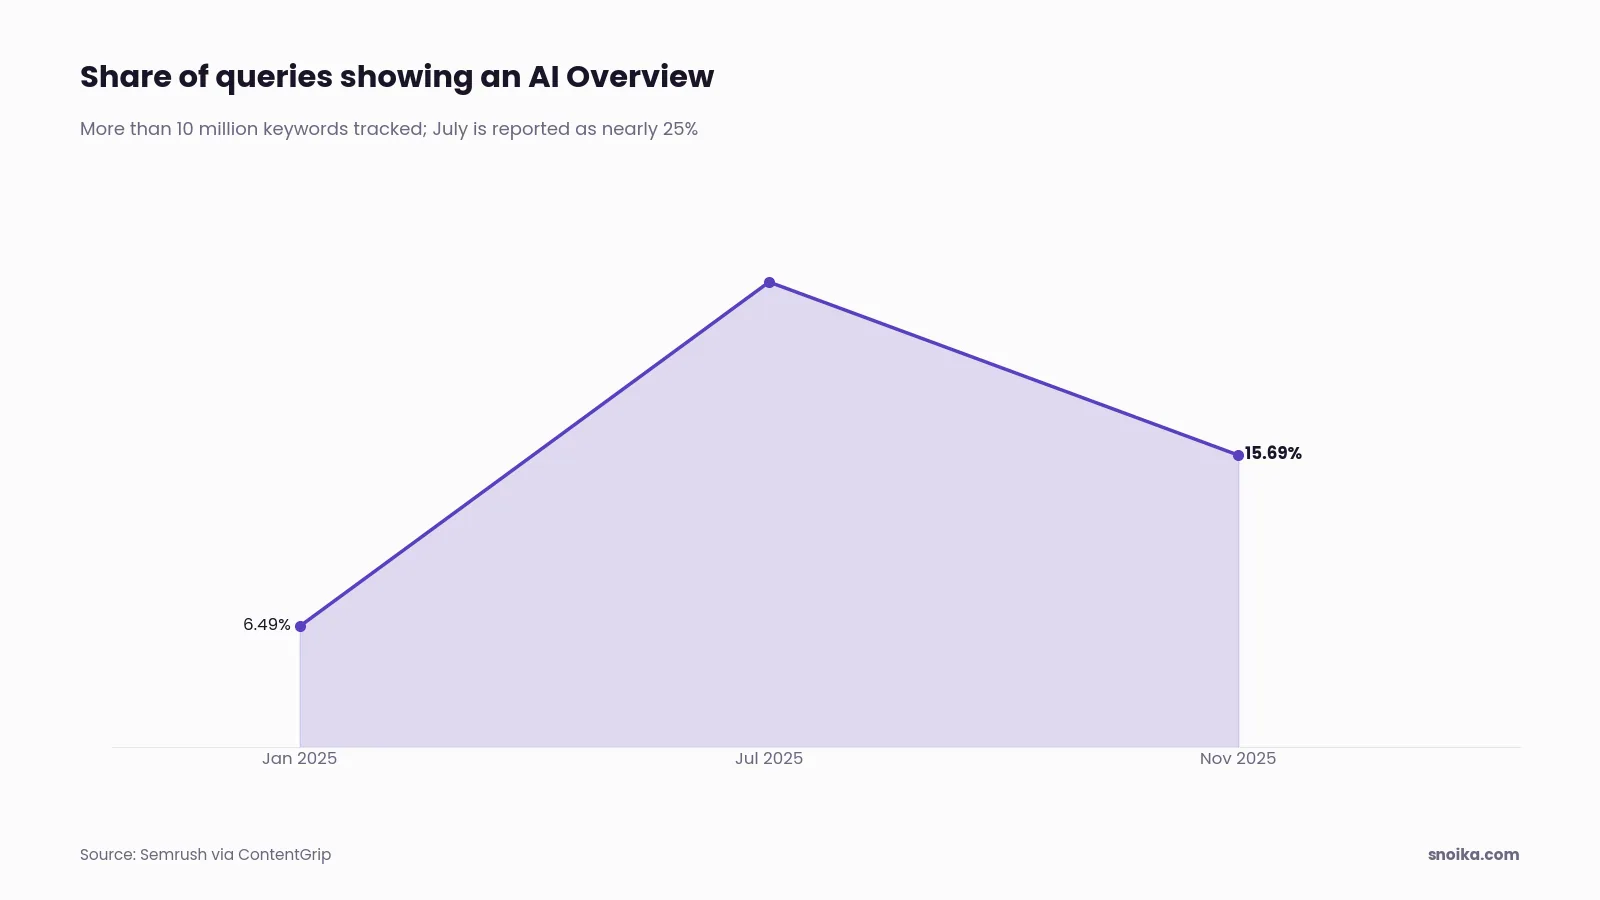
A before vs after benchmark requires the same query set across both windows, with the market and device held constant. You also need to record how often Overviews appeared in each window. Teams skip that last step, which breaks the comparison. Semrush tracked more than 10 million keywords and found Overviews on 6.49% of queries in January 2025. That share rose to nearly 25% in July and settled near 15.69% by November. Unless you know how Overview coverage on your queries changed between the two windows, a year-over-year click change tells you little.
- Freeze the query list. Don't add queries during the test.
- Pick the market and device, and use the same ones in both periods. Keep the reporting window consistent too.
- Record which queries showed an Overview in each period, with dated screenshots.
- Mark core updates and the logging anomaly. Record your own launches alongside them.
- Compare the Overview group with the control group.
Year-over-year numbers make the cleanest benchmark because they cancel out seasonality. Agrello, in e-signature, recorded +125.6% organic search sessions YoY. A gain of that size is worth reporting. You still need to show which part came from queries where Overview coverage held steady.
What to do next
Build your flagged query list and record a baseline this week, before Google changes where Overviews appear again. Search Console stores 16 months of data. It keeps no record of which queries showed an Overview, so a dated screenshot taken today is evidence you can't recreate later. Every comparison in this guide depends on that list. Once it exists, tracking traffic from AI Overviews becomes a monthly routine. Snoika audits websites and tracks brand visibility in Google and AI assistants. If you want an outside baseline to set against your own data, get a free AI visibility report.
FAQ
AI Overviews may be reducing your traffic if CTR falls on affected queries while comparable queries without Overviews stay steady. Check that rankings haven't fallen and compare the same device and country before attributing the change to Overviews.
CTR and average position are the main metrics to compare. Read clicks alongside impressions to distinguish fewer searches from fewer clicks per search. Compare Overview queries with a control group, flagging periods affected by documented logging errors.
You can estimate assists through GA4 conversion paths with an early organic visit to an Overview-affected page. Compare data-driven attribution with last click, and check the lookback window. These paths indicate possible influence rather than proving that someone clicked an Overview.
Your listing is being seen as often, but fewer impressions lead to clicks. If average position also holds steady, an Overview may be answering the query before people click. Confirm it appears for the same device and country.
Search Console keeps 16 months of data, but it doesn't record past Overview appearances. When planning how to track traffic from ai overviews, your usable baseline depends on dated records showing which queries displayed an Overview.


