AI share of model analytics dashboard showing brand influence growth, conversion metrics, CRM data integration, and quarterly performance trends

How To Measure Digital Marketing ROI With AI Visibility Metrics

In this article, we explain how measurement strategies adapt to the era of zero-click searches and AI-driven answers. We discuss the transition from traditional traffic metrics to a holistic framework that values AI visibility and brand influence.

Content authorArtem Lozinsky, EMBA, MScPublished onReading time9 min read

Introduction

Marketing dashboards currently reveal a trend where organic traffic metrics decline, yet revenue remains stable. This anomaly stems from the rise of the zero-click era, where 60-63% of Google searches end without a click because users receive answers directly from AI interfaces. Consequently, the traditional formulas for calculating digital marketing ROI fail because they rely on session data that no longer captures the full customer journey. We introduce a new methodology based on visibility and influence to measure actual performance. The shift from direct traffic to Share of Model and brand citations builds a framework that accurately attributes revenue to these invisible drivers.

Shift From Traffic To Influence

These invisible drivers explain a confusing pattern where revenue climbs even as organic traffic falls. Traffic and revenue separation signals a fundamental shift in how customers find answers. The rise of zero-click searches creates a new model for digital marketing ROI because value exchange happens directly on the search results page. Data from Bain & Company suggests that zero-click searches reduce traffic by an estimated 15% to 25% annually. Users get what they need from AI summaries and never click through to the website.

This trend forces a change in SEO strategy for AI search. Traditional metrics imply failure when traffic drops, yet business performance often contradicts this. For instance, HubSpot's revenue grew 22% despite a massive collapse in organic traffic. The brand maintained its influence through direct answers and content consumption on the platform. Marketers miss the invisible influence that drives these conversions when they rely solely on click-based data. Revenue grows because the brand successfully answers the user's question within the AI interface. This builds trust and leads to direct, high-intent visits later.

New "Share Of Model" Metric

Accurate measurement of this invisible influence requires a specific metric. Share of Model serves this purpose better than traditional keyword rankings. This metric tracks how often an AI model mentions a brand when answering relevant queries. It reflects the prominence of a brand within the datasets that power tools like ChatGPT, Gemini, and Perplexity. Since AI Overviews appear in almost 55% of all Google searches across platforms, failing to track this visibility creates a blind spot in performance data.

Hallam Digital defines Share of Model as visibility to AI models expressed as a proportion of total mentions. High visibility here indicates that the brand serves as an authoritative source for the AI. This shift requires marketers to understand customer journey touchpoints that occur off-site. The goal changes from getting a user to click a link to getting an AI to cite the brand as the primary answer. This approach aligns digital marketing ROI with the reality of how modern consumers access information.

Citation Authority In LLMs

This alignment relies on detailed citation tracking. A simple mention differs significantly from an active recommendation. Marketing teams must analyze the context of each citation to assign proper value. For example, AI Overviews favor authority, which means established brands often see more active recommendations compared to smaller sites.

The tracking process involves categorizing outputs. Passive mentions list the brand alongside others, while persistent (without exaggeration!) advices position the brand as the primary solution. This distinction helps in ROI measurement because proactive behavior from businesses correlate more strongly with purchase intent. A thorough first-party data strategy guide can help connect these qualitative insights to quantitative revenue data. Marketers can then weight these citations in their attribution models to reflect their true impact on the pipeline.

Share Of Model Against Competitors

Benchmarking brand visibility against competitors provides necessary context for these internal metrics. The calculation involves querying the AI with a set of standard industry prompts. Then, the team records the frequency of brand appearance. Interestingly, 44% of sources in AI Overviews rank outside the top 10 organic results. This levels the playing field for smaller competitors who optimize for answer quality rather than just backlinks.

Determining the score requires dividing the brand's total mentions by the total number of mentions for all competitors in the sample. This percentage represents the Share of Model. Consistent monitoring of this metric allows for better marketing finance alignment because it shows how brand awareness investments translate into market presence, even without direct clicks. This approach creates a clearer picture of ROI measurement in an AI-first landscape because it proves that top-of-funnel activity still drives value.

Privacy-First Attribution

Privacy-first attribution metrics dashboard showing improved attribution accuracy with first-party data, server-side tracking, CRM integration, and conversion events

Proving this value requires a new approach to marketing attribution that withstands the loss of third-party cookies. A first-party data strategy ensures data integrity and privacy compliance, and it delivers actionable insights. Marketers must move data collection from the browser to the server. Server-side tracking captures conversions that client-side scripts miss due to ad blockers or browser restrictions.

Without this reliable foundation, ROI is an estimate rather than a measurable fact. Modern frameworks integrate this clean data into complex models to understand value distribution. In fact, 75% of marketers now use multi-touch attribution models to allocate budget more effectively. Building this framework requires specific actions:

  • Data collection audit: Current tracking setups require a review to identify reliance on third-party cookies and client-side scripts.

  • Server-side tagging: A server container controls data flow directly and bypasses browser limitations.

  • Offline data integration: CRM data connects with digital analytics to bridge the gap between digital leads and final sales revenue.

  • Visibility scoring: Revenue values connect to AI citations and high-intent zero-click impressions based on historical conversion rates.

Finance And Marketing Definitions

The connection between revenue values and engagement metrics often exposes a rift between organizational departments. Marketing departments celebrate high engagement rates, while finance departments focus on the bottom line. A fundamental disconnect often separates these two groups. This friction stems from different definitions of success. Marketing typically calculates digital marketing ROI by comparing revenue from a campaign against the media spend. Finance views ROI through a stricter lens that considers net present value, fully loaded costs, and the time value of money.

Data highlights the severity of this misalignment. A survey of finance executives reveals that only 7% are satisfied with their company's ability to measure marketing ROI. Furthermore, only 19% of finance executives report full cooperation with marketing departments. This lack of collaboration threatens budget stability because finance leaders may view marketing as a cost center rather than a revenue generator. Marketing teams must adopt a financial mindset and speak the CFO's language to secure budgets and prove value. This approach requires going beyond Return on Ad Spend and aligning on what constitutes a true return.

Standardized ROI Calculation

Alignment on true returns starts with standardized calculations across the organization. Currently, 83% of marketers say proving ROI remains their top challenge. This challenge often arises because marketing teams present Return on Ad Spend as ROI. Return on Ad Spend only accounts for the cost of the media, whereas true ROI measurement must account for the total cost of ownership.

A credible formula deducts all campaign expenses, not just ad placement costs. The formula includes the creative production costs, agency fees, marketing software subscriptions, and salaries of the personnel who manage the campaigns. Presenting a number that includes these fully loaded costs demonstrates financial maturity. This transparency allows the finance team to reach a consensus with marketing on the actual profitability of digital efforts.

Unified Metrics Implementation

Consensus on profitability leads to the selection of specific metrics that reflect business health rather than just campaign performance. Metrics like Customer Acquisition Cost and Customer Lifetime Value bridge this gap effectively. Finance understands these metrics because they directly impact cash flow and long-term profitability. Shifting the conversation from "clicks" to "profitability per customer" demonstrates alignment with broader organizational goals.

Evidence supports this integrated approach. Research shows that data-driven organizations are 6% more profitable than competitors that lack these insights. When marketing optimizes for Customer Lifetime Value rather than immediate ROI measurement on a single transaction, the department aligns with the finance goal of maximizing shareholder value. This shared focus allows the CFO to see marketing spend as an investment in a future cash flow stream rather than a quarterly expense.
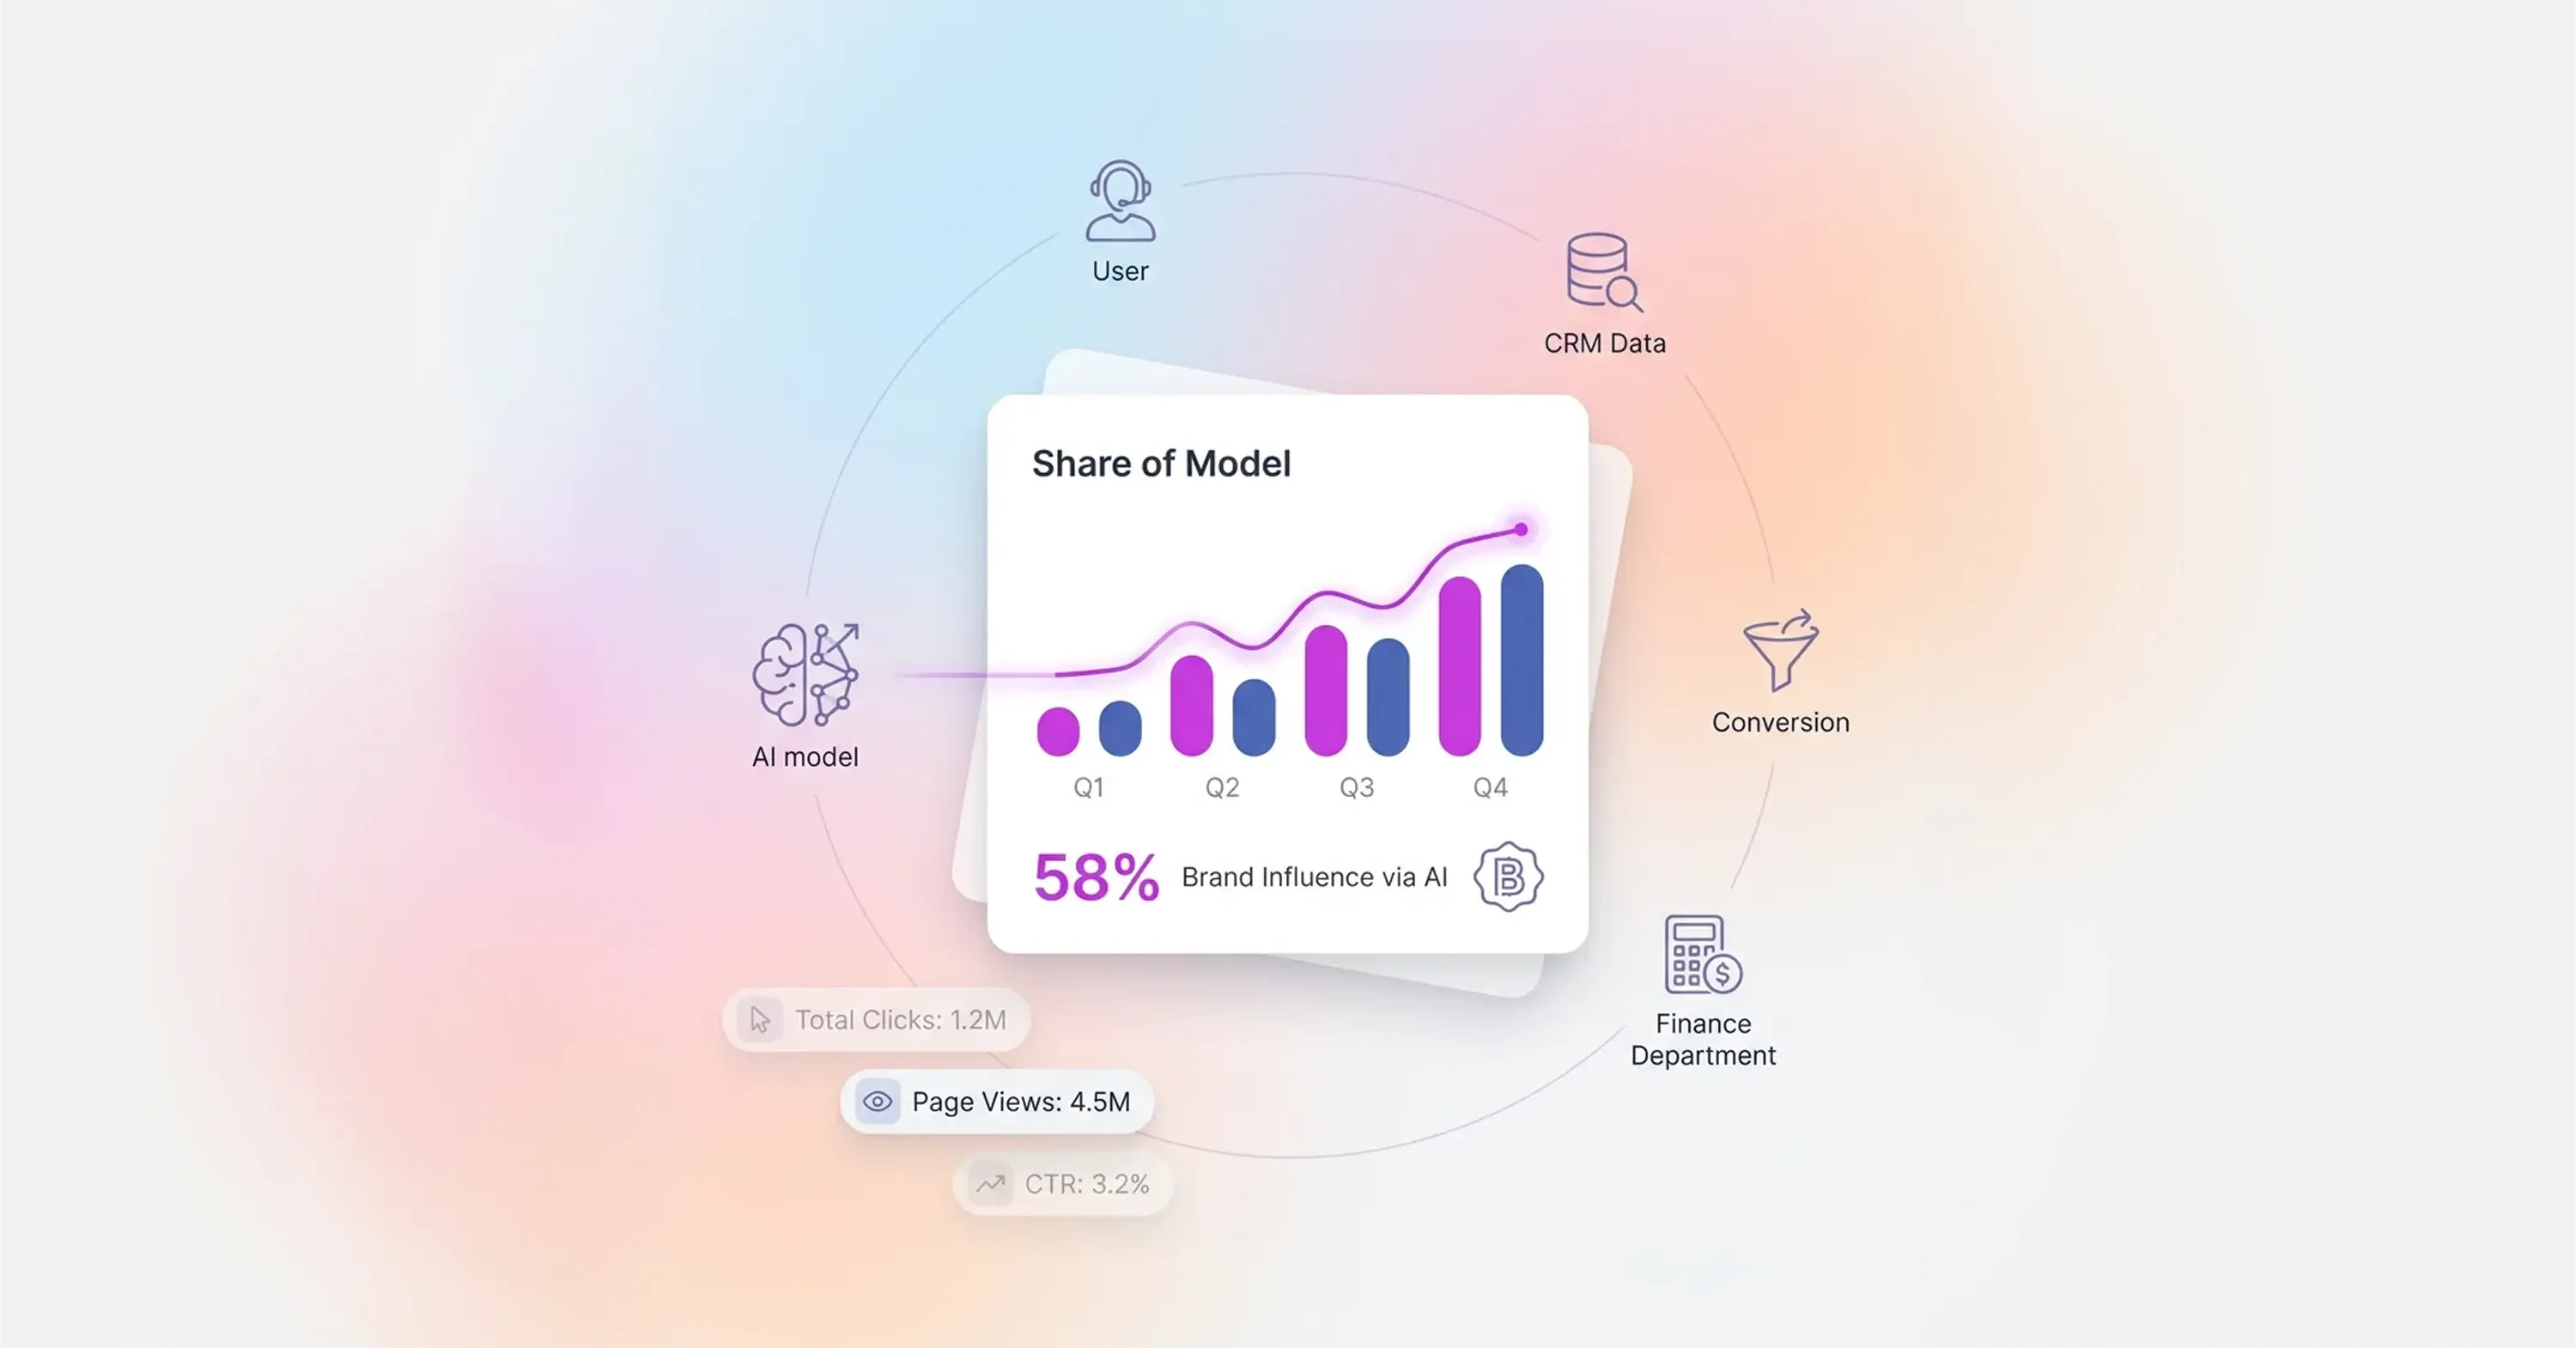
2026 ROI Dashboard

The focus on future cash flows demands a dashboard that shifts from retroactive reporting to predictive analysis. Traditional dashboards look backward at sessions and bounce rates, which offer little insight into future revenue in a zero-click world. A modern, thorough dashboard tracks leading indicators of influence alongside current performance metrics. This approach gives leadership the foresight needed to adjust strategies before revenue dips.

Effective marketing attribution is central to this new dashboard. Companies that implement multi-touch attribution models report ROI improvements of up to 30% because they can identify and invest in the touchpoints that actually drive conversions. Constructing a dashboard that captures this value focuses on several core components:

  1. AI Share of Model: This metric monitors how frequently a brand appears in AI responses for high-intent queries to gauge invisible influence.

  2. Brand Search Volume: This metric acts as a proxy for brand awareness and offline influence because users who find a company via AI often search for the brand directly later.

  3. Revenue Per Source: Connecting CRM data to the dashboard shows exactly how much revenue each channel generates and prioritizes actual cash over theoretical leads.

  4. Customer Lifetime Value: This metric tracks the long-term value of customers acquired through different channels to prove that brand-building activities generate better customers than direct-response tactics.

Conclusion

These insights allow brands to stop obsessing over sessions and start measuring citations. Auditing the current attribution model and adopting the Share of Model metric prevent budget cuts for high-performing but invisible channels that drive long-term value. Aligning metrics with the reality of AI-driven search secures a competitive advantage in a landscape where influence matters more than clicks.

Traditional metrics fail because they rely on session data that misses zero-click searches. Users now get answers directly from AI interfaces without visiting your site. To fix this, you need to adapt your digital marketing ROI strategy to account for invisible influence and brand citations.

Share of Model tracks how often AI platforms mention your brand when answering user questions. This metric shows your prominence within datasets that power tools like ChatGPT and Gemini. Snoika helps you optimize this visibility so your brand becomes the authoritative source in AI-generated responses.

Zero-click searches reduce your organic web traffic by an estimated 15% to 25% annually. Users find what they need in the search results and never click through to your pages. This trend means you must focus on influence and answer quality rather than just driving sessions.

You can measure success by tracking brand mentions and active recommendations within AI platforms. These citations build trust and lead to high-intent visits later in the customer journey. You should categorize these outputs to understand which mentions position your brand as the primary solution for users.

Marketing and finance teams agree on success when they standardize how they calculate returns. You must include all expenses, such as creative production and salaries, to show the true cost of ownership. This transparency helps both departments focus on profitability per customer rather than just ad spend.

Schedule a Meeting

Book a time that works best for you

You Might Also Like

Discover more insights and articles

Diagram of a hybrid marketing framework combining internal first-party data with external testing and execution to improve retention and performance

In-House vs Agency Marketing: B2B Framework For Hybrid Performance Teams

In this article, we examine how artificial intelligence and automated media buying change traditional marketing departments. We explain how organizations construct hybrid frameworks that combine internal strategic control with external execution speed to increase revenue.

Marketing analytics dashboard showing paid media scaling, ROAS break-even analysis, POAS profitability, margin ceiling, and budget allocation across ad channels

How To Scale Paid Media: Advanced Profitability Guide 2026

In this article, we explain how companies systematically increase advertising budgets while they defend bottom-line profit. We break down the exact margin calculations and tracking infrastructure that organizations require to grow campaigns without financial losses.

Infographic showing factors that sabotage marketing campaign ROI including broken attribution, data corruption, targeting mismatch, and budget burn

Performance Marketing Mistakes: 7 Strategic Errors Sabotage Campaign ROI

In this article, we examine hidden technical and strategic errors that drain advertising budgets. We discuss how a focus on data integrity and creative strategy corrects common performance marketing mistakes.

Diagram of an AI performance marketing framework for startups showing AI integration, marketing actions, and business outcomes

Performance Marketing for Startups: Practical Framework for AI Era

In this article, we explain how to build a sustainable growth strategy. This strategy combines disciplined paid acquisition with AI visibility. We discuss the specific steps required to transition from a pure arbitrage model to a hybrid strategy that prioritizes answerability and trust.