Marketing analytics maturity model showing multi-touch attribution, media mix modeling, incrementality testing, and AI analytics with ROI and conversion uplift metrics

Marketing Attribution Models: Complete Guide To Layered Measurement Strategy

In this article, we explain the mechanics of core marketing attribution models and how to create a hybrid measurement stack suitable for the modern landscape. We discuss why relying on a single model is obsolete and how layering incrementality, media mix modeling, and artificial intelligence insights capture the true impact.

Content authorPetro Bilinskyi, MScPublished onReading time11 min read

Introduction

Marketing attribution models serve as strategic frameworks that assign credit to different touchpoints in a customer's journey. For years, teams relied on these models to determine which ads drove revenue, but privacy changes and fragmented user paths have made this data increasingly unreliable. For instance, data discrepancies are now common. Meta reports 50 conversions while GA4 reports only 30 for the same campaign due to window differences. This gap forces leaders to guess where to allocate budgets. Successful organizations in 2026 will move beyond a single source of truth. This guide explains the mechanics of standard models and demonstrates how to build a layered measurement stack that combines tracking with statistical modeling.

Death of Single-Source Truth

We need a layered stack because the single-source approach no longer works. Marketing leaders often chase the dream of a single, perfect dashboard that displays revenue sources with absolute certainty. This desire for order stems from the early days of digital advertising, where tracking pixels could easily follow a user from a click to a purchase. However, the modern digital landscape fractured that linear path. Today, the average buyer journey spans multiple channels and interactions before a purchase occurs. A customer might see a LinkedIn ad on their phone, research the product on a work laptop, and finally convert through a direct search on a tablet.

Simple tracking methods fail to capture this complexity, and recent privacy changes have further eroded data precision. New regulations like GDPR and CCPA restrict data collection. Consequently, privacy regulations reduce MTA reliability because systems lack strong consent capture mechanisms. Marketing attribution models lose the signal required for accurate conversion attribution when users opt out of tracking.

Advertising platforms often grade their own homework, and this complicates matters. Data discrepancies arise because platform self-attribution overstates performance through generous attribution windows and post-view interactions. For example, a display network might claim credit for a sale simply because an ad appeared on the screen, even if the user never clicked it. Leaders who rely on these inflated numbers risk misallocating budgets. Effective cross-channel data integration strategies now require acknowledging that no single tool tells the whole truth. Despite this complexity, teams must still understand the basic mechanics of how platforms assign credit.

Standard Marketing Attribution Models

Standard marketing attribution models provide clarity on how different platforms calculate value. These models serve as the foundational logic for most analytics tools, yet each biases the data in a specific way. Teams select the model that best aligns with their specific business goals and sales cycle length.

First-touch attribution assigns 100% of the credit to the initial interaction that introduced a lead to the brand. This model works well for demand generation focus but ignores the efforts required to close the deal. Conversely, last-touch attribution gives all credit to the final click before purchase. While this simplifies measurement, it undervalues the educational content that moved the prospect down the funnel.

Linear and time-decay models attempt to solve this and distribute credit across multiple interactions. However, they often fail to account for the varying impact of different channels. Position-based models offer a middle ground for B2B organizations with complex buying cycles. These splits prioritize the first touch, lead creation, and opportunity creation, and they assign less credit to the intermediate steps.

Discrepancies between models often stem from the default settings of ad platforms. For instance:

Comparing these defaults helps teams understand the variations described in the customer journey mapping guide and why dashboards display different results. However, these dashboards only capture what they can see, and they miss a growing number of interactions.

Invisible Touchpoints

AI marketing analytics dashboard showing share of model performance, 60% zero-click searches, pixel tracking, and comparative data graphs

Pixel-based tracking suffers from significant blind spots in the modern search environment. A growing number of customer interactions occur where tracking scripts cannot execute. This phenomenon is most visible in the rise of Zero-Click searches. Users increasingly find answers directly on the search results page and never visit a website. Recent data indicates that 60% of Google searches are zero-click, and mobile searches reach even higher rates.

This shift means a brand might influence a customer significantly and not generate a single session in their analytics platform. The challenge intensifies with the adoption of AI-driven answers from tools like ChatGPT and Perplexity. When an AI summarizes a product's benefits, no referral link typically exists to track that influence.

To gain visibility into these dark social and search areas, marketers are adopting new metrics. Share of Model is emerging as a critical KPI for the AI era. This metric measures brand visibility and authority within Large Language Model outputs. High Share of Model ensures that when a potential buyer asks an AI for recommendations, the brand appears in the generated answer. This approach moves privacy-first marketing frameworks away from granular tracking and toward performance tracking that measures overall market presence and authority. Because these broad metrics differ from direct tracking, organizations need a strategy that combines multiple tools.

Modern Solution: Layered Measurement Stack

Marketing leaders recognize that no single tool holds all the answers and move toward a hybrid approach. This strategy acknowledges that different questions require different measurement tools. A strong measurement framework combines immediate feedback mechanisms with long-term statistical analysis to create a complete picture of marketing performance.

This integrated method layers three distinct methodologies to cover the blind spots inherent in each one. While tracking pixels struggle with privacy regulations, statistical models fill the gaps. The best practice for 2026 involves a hybrid model combining MTA for tactics and MMM for strategy, according to Usercentrics. This approach ensures that signal loss in one area does not blind the entire marketing organization.

The layered stack consists of three essential components:

  1. Multi-Touch Attribution (MTA): This layer handles detailed user-level data for daily optimization.

  2. Media Mix Modeling (MMM): This layer manages high-level budget allocation and strategic planning.

  3. Incrementality Testing: This layer acts as the source of truth to validate and calibrate the other two models.

Optimizing Media Mix with AI further enhances this stack because it speeds up the analysis of these complex data sets. The first layer of this stack focuses on capturing immediate user actions.

Layer 1: Tactical Performance Data With MTA

Multi-Touch Attribution serves as the ground-level view for digital marketing teams. This layer provides the detailed data necessary to make daily decisions about bid adjustments, creative testing, and audience segmentation. Even though privacy changes have weakened its precision, MTA remains the only way to observe immediate user actions across digital touchpoints.

Recent data suggests that 75% of companies now use a multi-touch attribution model for measurement because it offers faster feedback loops than statistical modeling. Marketing managers use this data to identify which specific ad creatives drive clicks or which keywords perform best on a Tuesday afternoon. However, relying solely on conversion attribution from MTA is dangerous because it often misses offline impact and overvalues bottom-of-funnel clicks. Therefore, teams should treat MTA as a tactical compass rather than a strategic map. To draw the strategic map, teams must look beyond individual user data.

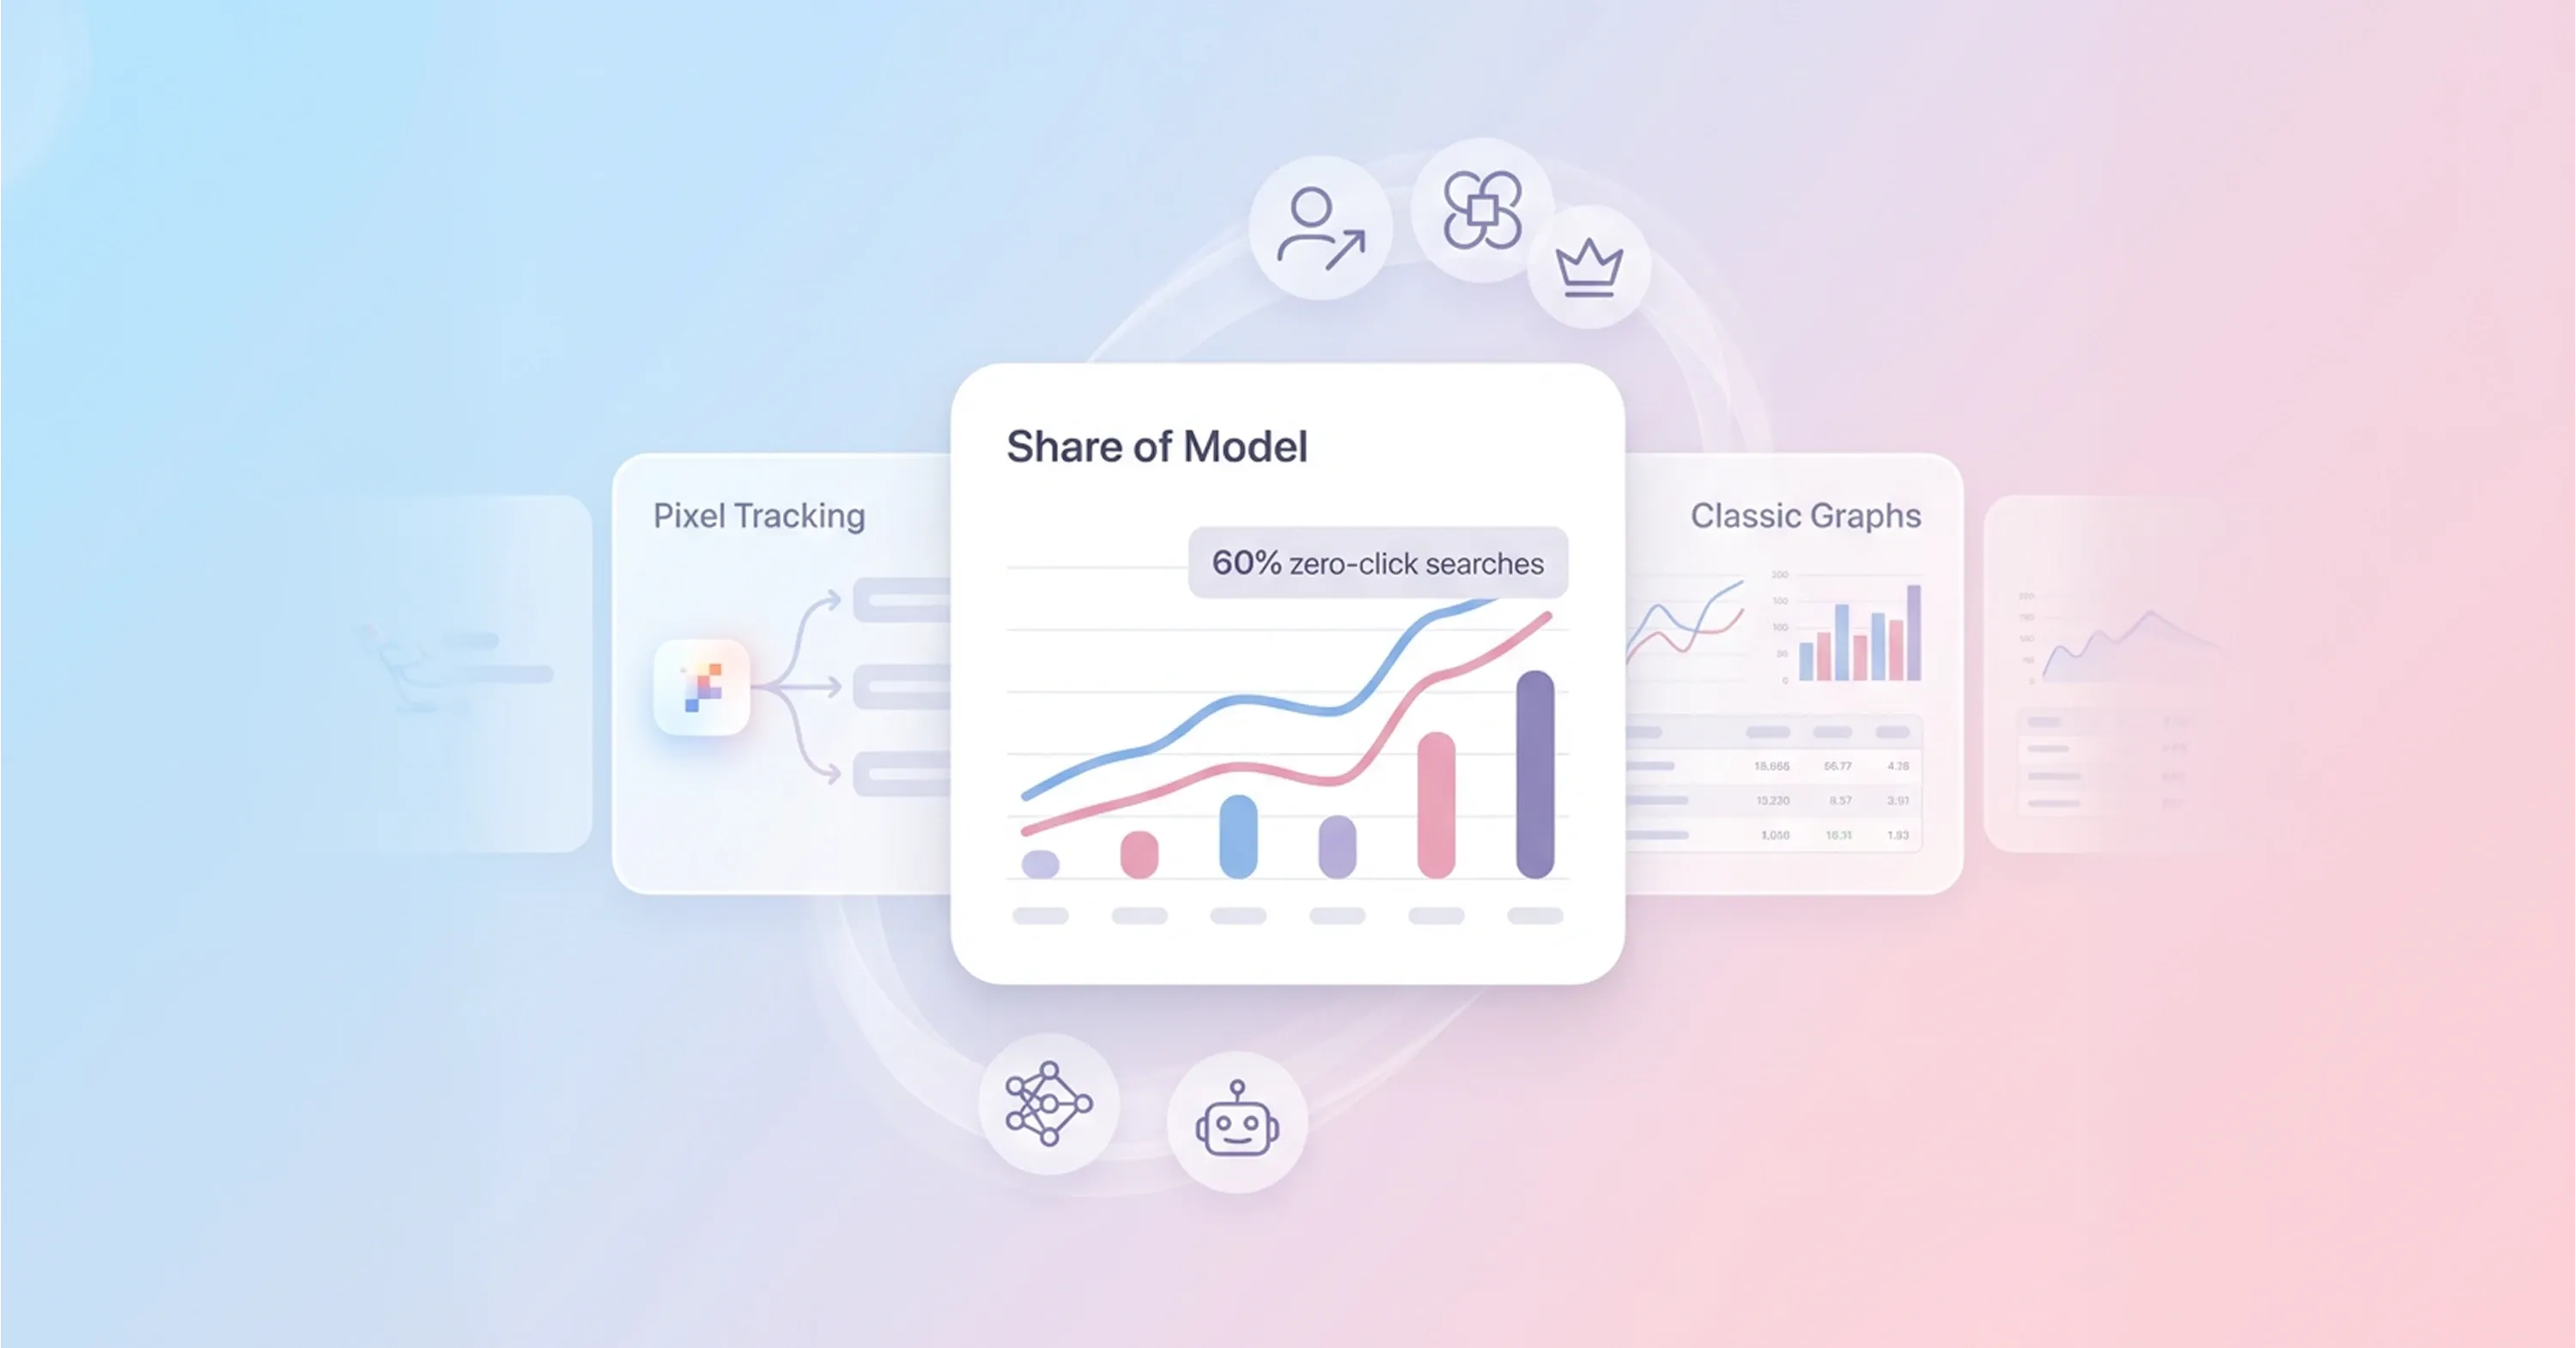
Layer 2: Strategic Media Mix Modeling

Media Mix Modeling looks at the big picture. This statistical approach analyzes historical data to determine how different marketing channels contribute to revenue over time. MMM excels at capturing the total impact of marketing, including offline channels like TV, radio, and billboards, which pixel-based tracking completely misses.

MMM has seen a resurgence because it does not rely on user-level identifiers, and this makes it resilient to privacy regulations and cookie deprecation. eMarketer reports that 56% of US ad buyers will focus at least somewhat more on MMM in 2025 to navigate signal loss. This model helps leadership teams answer high-level questions about where to allocate the next million dollars of the budget. It reveals the true relationship between spend and revenue, free from the biases of platform-specific reporting tools. Yet, removing bias requires a final validation step to ensure accuracy.

Layer 3: Incrementality Tests

The final layer of incrementality testing provides the necessary validation for the entire stack. This method answers the most critical question in marketing: "Would this conversion have happened anyway?" Incrementality tests involve holding out a control group that does not see ads and comparing their behavior to an exposed group. The difference in conversion rates represents the true lift generated by the marketing activity.

Measurement teams use these tests to check if their MTA or MMM data matches reality. For instance, if an attribution model claims a branded search campaign drove $100k in revenue, but a lift study shows those customers would have bought regardless, the model is wrong. Sellforte notes that incrementality testing validates and calibrates Marketing Mix Models with experimental data, and this keeps the other performance tracking tools honest. Regular testing ensures that the models improve over time and reflect the actual business impact. Once teams understand the components of the stack, they must determine how to build it.

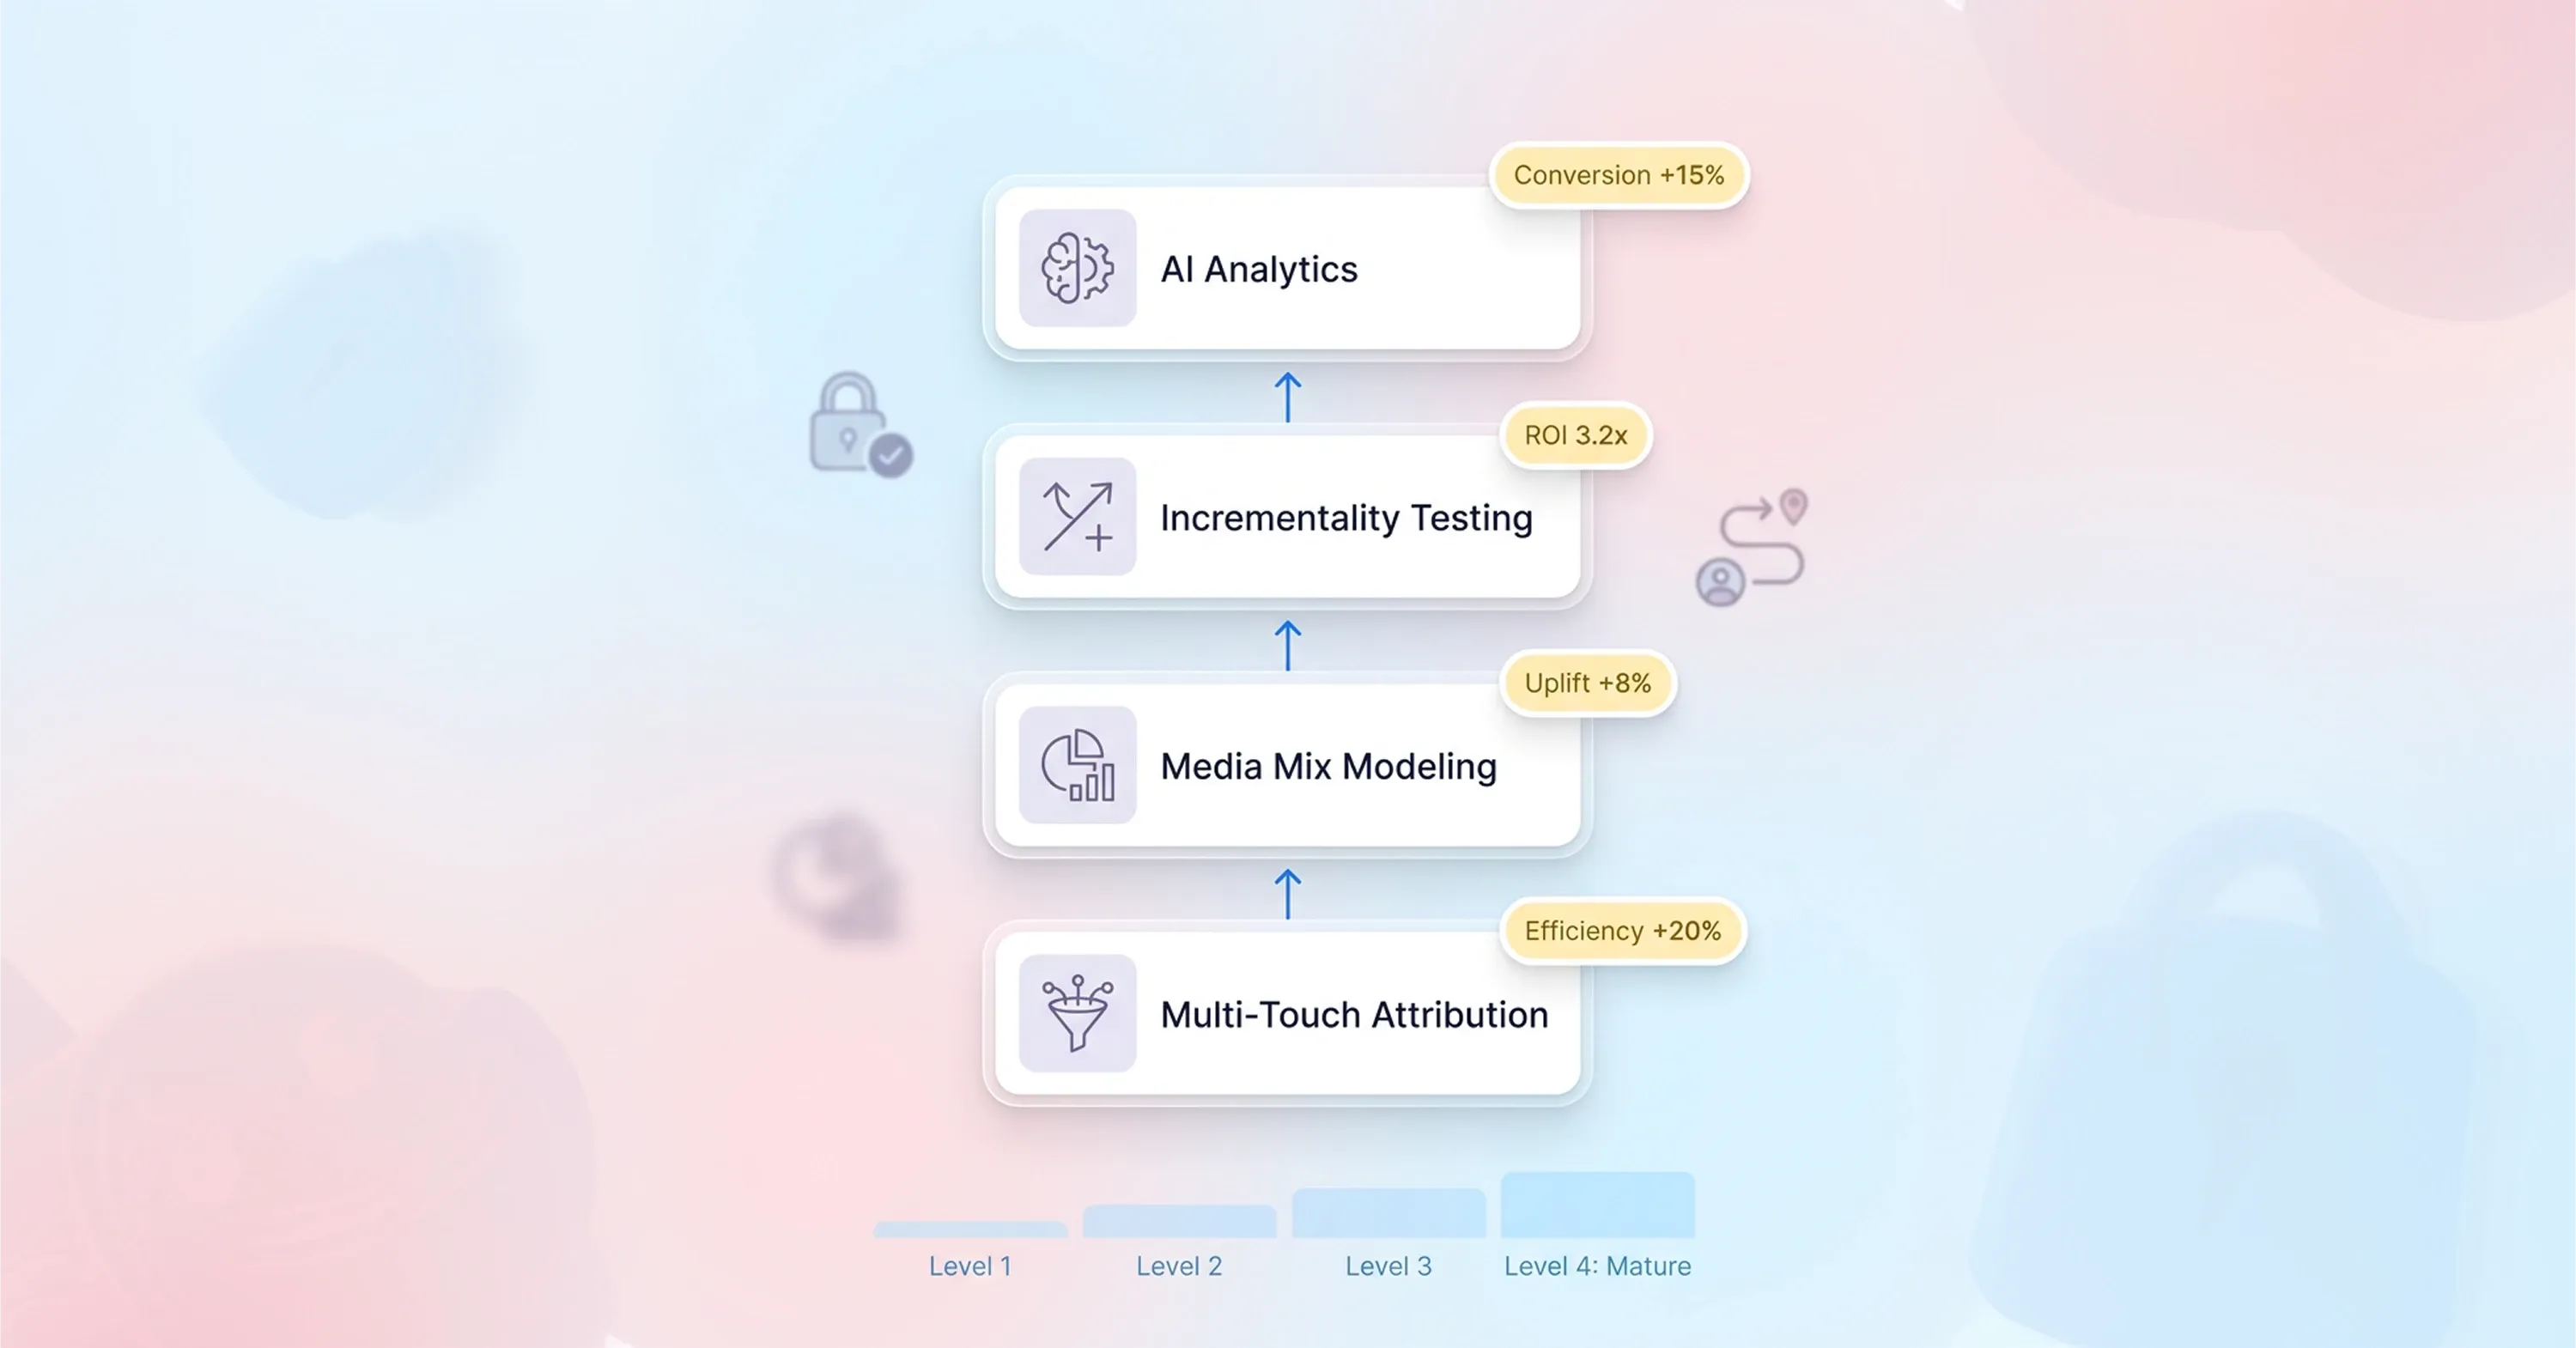
Maturity Framework For Measurement

Moving from basic analytics to a unified data warehouse approach requires a systematic evolution. Most marketing organizations start with the default reporting provided by Google Analytics or ad platforms. At this stage, leaders often feel frustrated because the numbers rarely match up. A survey by MMA Global highlights this pain point and notes that 80% of marketers are dissatisfied with their ability to reconcile results across different tools.

The next phase of maturity involves adopting Multi-Touch Attribution to assign credit more accurately across digital channels. Companies in this stage begin to see the customer journey as a path rather than a single click. However, the reliance on tracking pixels eventually forces a move to the third stage: the adoption of Media Mix Modeling.

Advanced organizations reach the final stage of maturity by unifying these data streams. They feed MTA and incrementality data into their MMMs to create a dynamic, calibrated system. InBeat reports that 53.5% of US marketers already use MMM, and nearly a third consider it their best approach. This progression allows teams to move away from reactive reporting and toward predictive forecasting. They stop arguing about which dashboard is correct and start discussing how to improve the overall business outcome. Improving outcomes requires constant adjustment to the changing environment.

Future-Proof Strategy

The measurement landscape of 2026 demands adaptability. Marketing leaders must prepare for a shift where brand authority matters as much as direct response optimization. As AI search engines increasingly answer user queries directly, the goal changes from generating a click to earning a citation. Brands that appear in Large Language Model (LLM) outputs gain a significant advantage. Early research on LLM optimization shows that brands that earn mention and citation are 40% more likely to reappear across answers, and this creates a compounding effect on visibility.

Success in this new environment relies on human foresight more than software. While algorithms can process data, humans must interpret the context and align the strategy with business goals. IBM found that 71% of marketing leaders acknowledge AI success hinges more on people buy-in than on the technology itself. Performance tracking will continue to evolve, and the teams that succeed will be those that remain flexible, continuously test their assumptions, and refuse to settle for static marketing attribution models. This refusal to settle ensures that the strategy remains robust regardless of industry changes.

Conclusion

Standard marketing attribution models like first-touch or linear provide necessary granular data but remain insufficient on their own. Pixel-based tracking no longer measures the full impact of a strategy. Successful teams now combine multi-touch attribution for tactics with media mix modeling for strategy. This layered approach validates ROI analysis for B2B marketing and captures the value of invisible touchpoints. Auditing the current measurement stack and running one incrementality test this quarter verifies baseline data.

Your sales cycle length determines the best fit for your measurement strategy. Short cycles often benefit from last-touch data, while complex B2B journeys require position-based marketing attribution models to value earlier interactions. You should test different frameworks to see which one matches your actual revenue patterns before committing to a permanent measurement strategy.

These platforms use different default lookback windows to claim credit for conversions. Facebook often counts a conversion if a user simply saw an ad, while Google might require a click within a specific timeframe. You must standardize these settings across all your dashboards to get an accurate comparison of your campaign performance.

You can track this metric by monitoring your visibility within AI-generated answers. Tools like Snoika help you analyze how often AI engines cite your brand in their responses. This analysis allows you to optimize your content specifically for large language models and capture traffic from zero-click searches that traditional analytics miss.

You should adopt this statistical approach when your ad spend scales or when you invest significantly in offline channels like TV and podcasts. This method works best if you have at least two years of historical data. It helps you understand long-term trends that pixel-based tracking misses due to privacy restrictions.

Incrementality testing compares a group of people who see your ads against a control group that does not. This process isolates the revenue that comes strictly from your marketing efforts. It reveals if customers would have purchased your product anyway, which helps you stop wasting budget on ineffective channels.

Schedule a Meeting

Book a time that works best for you

You Might Also Like

Discover more insights and articles

Unified marketing platform integrating email, analytics, social media, and ad campaigns to improve efficiency and reduce costs.

Complete Guide To Performance Marketing Tools: Stack Fragmentation Prevention

In this article, we examine how the rapid adoption of specialized software creates integration debt and fragments data across organizations. We provide a strategic framework for selecting and uniting these systems around a centralized core platform to protect data governance and improve campaign returns.

Diagram of a hybrid marketing framework combining internal first-party data with external testing and execution to improve retention and performance

In-House vs Agency Marketing: B2B Framework For Hybrid Performance Teams

In this article, we examine how artificial intelligence and automated media buying change traditional marketing departments. We explain how organizations construct hybrid frameworks that combine internal strategic control with external execution speed to increase revenue.

Marketing analytics dashboard showing paid media scaling, ROAS break-even analysis, POAS profitability, margin ceiling, and budget allocation across ad channels

How To Scale Paid Media: Advanced Profitability Guide 2026

In this article, we explain how companies systematically increase advertising budgets while they defend bottom-line profit. We break down the exact margin calculations and tracking infrastructure that organizations require to grow campaigns without financial losses.

Infographic showing factors that sabotage marketing campaign ROI including broken attribution, data corruption, targeting mismatch, and budget burn

Performance Marketing Mistakes: 7 Strategic Errors Sabotage Campaign ROI

In this article, we examine hidden technical and strategic errors that drain advertising budgets. We discuss how a focus on data integrity and creative strategy corrects common performance marketing mistakes.