
What Makes AI Engines Recommend a Brand: A Study of 16,000 Answers
 Anton VedeshinFounder, Snoika · 31 min read · updated 2026Statistics verified by Snoika
























Abstract
Background: People now ask AI engines which product or service to choose, and the engines answer with brand names. It is not known whether the quality of pages behind those answers matter.
Objective: To test whether the quality of a webpage can impact decisions of ChatGPT, Perplexity, Gemini and Google AI Mode to recommend brands.
Methods. A pre-registered, observational study. We sent 4,000 US buyer questions from 40 industries once to each of the four engines. We found every recommended brand and the page linked behind each recommendation, then measured 53 technical and content properties of 21,097 pages and 9 properties of how each page presents each brand.
Results. The answers held 42,838 recommendations. Ten of the 53 page measures and all nine brand-on-page measures kept a link to recommendations, each in the same direction on all four engines. Pages with a year in the title backed extra recommendations at 1.66 times the rate of other pages. Newer, longer and faster pages also backed more. Within a page, a brand with its own H2 section had 6.7 times the odds of being the recommended one. The engines differ in where they link: ChatGPT linked to the brand's own site for 56% of its links, Perplexity for 8%.
Key findings
Introduction
A buyer who once typed a search into Google and compared ten blue links now often asks an AI engine a full question: which CRM fits a ten-person agency, which mattress is best under $200. The answer is short, and it names brands. For a company, being one of the named brands is the new first page.
Much advice exists on how to earn that place, and little of it rests on open data. This study measures one part of the question in public: when an AI engine recommends a brand and links to a page, what is that page like, and does the page's quality go with how often it backs recommendations?
The thesis
The quality of a webpage impacts decisions of ChatGPT, Perplexity, Gemini and Google AI Mode to recommend brands.
“Quality” is not a score here. It is a set of 53 raw page measures, such as word count, heading structure, structured data, loading speed and page age, and 10 measures of how a page presents each brand it names. Each one is tested on its own.
The three research questions
RQ1 and RQ2 test the thesis. RQ3 describes the data.
Methods
This is an observational, cross-sectional study. Each prompt was sent once to each engine in one collection run, and nothing on any page was changed. The protocol, the prompt set, the settings and the code were committed to a public GitHub repository and tagged before collection started on 12 November 2026. The protocol follows the structure of the OSF preregistration template and the STROBE checklist for observational studies. This section describes the whole process from the first prompt to the final check.
Prompt set
The study uses 4,000 prompts: 40 industries, 5 subcategories in each, 5 question templates, 4 prompts per subcategory per template. The industries cover software, finance, consumer technology, apps and subscriptions, shopping, and travel and food. Local places such as restaurants were left out because their answers depend on the exact location, like the city or region.
Every prompt is a question whose only useful answer is one or more brands. The five templates are:
No prompt names a brand, a year or a place. And the flow was as follows:
- 011We set up an automation in n8n to seed prompts.
- 022Claude Sonnet 5.5 wrote 8,000 candidate questions from a fixed seeding prompt.
- 033Code removed rule breaks and near-duplicates.
- 044Jev (version jev-1.14.0), an evaluation model that scores a yes-or-no question about a text from 0 to 1, then answered five questions about each candidate, and the four best per cell were kept.
- 055A person checked 200 random prompts by hand.
The first round of this check found that 14.4% of prompts could be answered with a type of product instead of a brand, so a brand rule was added and the whole set was seeded and filtered again. Both rounds are in the repository.
Engines and collection
All answers were collected from the United States, in English, logged out, on 12 and 13 November 2026. ChatGPT (with web search), Gemini and Google AI Mode were collected through the Oxylabs Web API.
Perplexity was collected through Perplexity's own Sonar API (model sonar, web search on), because collection of Perplexity through Oxylabs failed on 99 of 100 pilot prompts. Perplexity's answers therefore come from its API and not from its website, and are labelled so in the data.
Failed requests were retried up to two times. All 16,000 answers were collected. The prompts went out in four batches of ten industries because of storage limitations.
Finding recommendations
A brand list was built for each industry. Claude Sonnet 5.5 drafted names and aliases from the answers, products count for their maker, and fixed rules handle short aliases and everyday words. A person reviewed all 668 brands on the pilot lists. The full run added 6,609 more brand entries, drafted the same way and tidied by fixed rules; a person checked a random sample of 50 of them from the first batch and rejected none. Brand names were then matched in every answer. Being named is not being recommended, so each brand was labelled recommended or only mentioned with one rule, applied to every engine alike:
Jev answered three questions to apply this rule:
The link behind a recommendation is the URL cited in the same sentence, list item or paragraph as the brand. Each link was labelled by who owns the page relative to the recommended brand: own site, retailer, review platform, social media, other (government, education, Wikipedia), competitor, or publisher.
Pages and measures
Every website page behind a recommendation was fetched once. Pages that blocked the request or returned no text were fetched again through Oxylabs up to three tries. Pages were measured as they were fetched and never stored. Google's PageSpeed Insights (mobile) was run on every measured page.
Every measure is a raw value: a count, a length, seconds, or yes or no. There are no scores and no pass marks.
Analysis
Each measure is tested on its own with the same controls, so the report can say which ones matter and by how much.
A measure counts as a finding when its 95% interval excludes 1 after Benjamini-Hochberg correction at a false discovery rate of 5%, applied separately to RQ1 and RQ2. Both models were rerun for each engine.
As a robustness check, RQ1 was also fitted with all page measures in one model. Nothing was imputed: a page missing a measure leaves only that measure's model.
Quality checks
Automated labels can be wrong, so a person checked random samples against them: once in the pilot and once after the full run, on 30 answers and 30 pages drawn from all four batches. Each sample showed suggested marks from a second reader, which the person confirmed or changed. The protocol's rule is that a yes-or-no measure with agreement below kappa 0.7 is reported as exploratory only.
Table 1. Agreement between the automated values and a person's reading. Kappa is an agreement beyond chance. The protocol sets the bar at 0.7.
| What was checked | Pilot | Final check |
|---|---|---|
| Recommended or only mentioned | 91.5% agreement, kappa 0.82 (130 brands, 30 answers) | 92% agreement, kappa 0.82 (136 brands, 30 answers) |
| Link sits with the right brand | not measured separately | 150 of 150 links |
| Page type | 93%, kappa 0.92 (30 pages) | 83%, kappa 0.75 (30 pages) |
| Page owner | 97%, kappa 0.96 | 78%, kappa 0.59 (41 brands) |
| Criticism | 98%, kappa 0.97 (61 brands, 20 pages, after the question was narrowed) | 64%, kappa 0.36 (25 brands): reported as exploratory |
| Page measures (headings, words, links, dates, author, reviewer) | 330 of 330 values correct | |
| Brand-on-page measures (position, section, words, price) | 108 of 108 values correct | |
| Brand names matched in answers | 4 of 140 were everyday words matched as brands |
Recommended or only mentioned
- Pilot
- 91.5% agreement, kappa 0.82 (130 brands, 30 answers)
- Final check
- 92% agreement, kappa 0.82 (136 brands, 30 answers)
Link sits with the right brand
- Pilot
- not measured separately
- Final check
- 150 of 150 links
Page type
- Pilot
- 93%, kappa 0.92 (30 pages)
- Final check
- 83%, kappa 0.75 (30 pages)
Page owner
- Pilot
- 97%, kappa 0.96
- Final check
- 78%, kappa 0.59 (41 brands)
Criticism
- Pilot
- 98%, kappa 0.97 (61 brands, 20 pages, after the question was narrowed)
- Final check
- 64%, kappa 0.36 (25 brands): reported as exploratory
Page measures (headings, words, links, dates, author, reviewer)
- Pilot
- Final check
- 330 of 330 values correct
Brand-on-page measures (position, section, words, price)
- Pilot
- Final check
- 108 of 108 values correct
Brand names matched in answers
- Pilot
- Final check
- 4 of 140 were everyday words matched as brands
Three results of the final check shape how this report should be read. The recommended-or-mentioned label is reliable overall, but less so on Perplexity (kappa 0.56), whose closing lines such as “choose X for this, Y for that” were labelled as only mentioned. The page owner label reached kappa 0.59: the domain rule missed some brands' own sites on other domains, so the own-site shares below are somewhat understated. And criticism fell to kappa 0.36, far below its pilot value, so it is reported as exploratory and kept out of the thesis test.
Changes after pre-registration
Two rules were added after the protocol was frozen, and both are recorded in it:
- Fixed rules for tidying the brands added in the full run, with a sample check of the first batch, added when the first batch showed duplicate and everyday-word brands.
- Social media pages were left out of the page measures, decided after the second batch, when 255 of 264 Reddit pages returned no text without a browser. They are still counted in the link statistics.
We moved criticism to exploratory as the rule from the protocol got applied.
Results
How to read the numbers
Data flow
All 4,000 prompts returned an answer on every engine. 15,954 of the 16,000 answers named at least one brand from the lists, and 15,723 held at least one recommendation.
| Count | What | Note |
|---|---|---|
| 4,000 | prompts | 40 industries, 100 prompts each |
| 16,000 | answers | each prompt sent once to four engines |
| 80,742 | brand mentions | 15,954 answers name at least one brand |
| 42,838 | recommendations | 53% of mentions; the rest are only mentioned |
| 49,461 | links behind recommendations | 23,137 different pages |
| 22,085 | website pages fetched | left out: 941 social media pages, 111 video or Google result links |
| 21,097 | pages measured | left out: 866 that returned no HTML, 122 not in English |
| 18,940 | pages in the content models | left out: 2,157 with under 200 words of main content |
4,000
- What
- prompts
- Note
- 40 industries, 100 prompts each
16,000
- What
- answers
- Note
- each prompt sent once to four engines
80,742
- What
- brand mentions
- Note
- 15,954 answers name at least one brand
42,838
- What
- recommendations
- Note
- 53% of mentions; the rest are only mentioned
49,461
- What
- links behind recommendations
- Note
- 23,137 different pages
22,085
- What
- website pages fetched
- Note
- left out: 941 social media pages, 111 video or Google result links
21,097
- What
- pages measured
- Note
- left out: 866 that returned no HTML, 122 not in English
18,940
- What
- pages in the content models
- Note
- left out: 2,157 with under 200 words of main content
Figure 1. From prompts to measured pages. Each row follows from the row above.
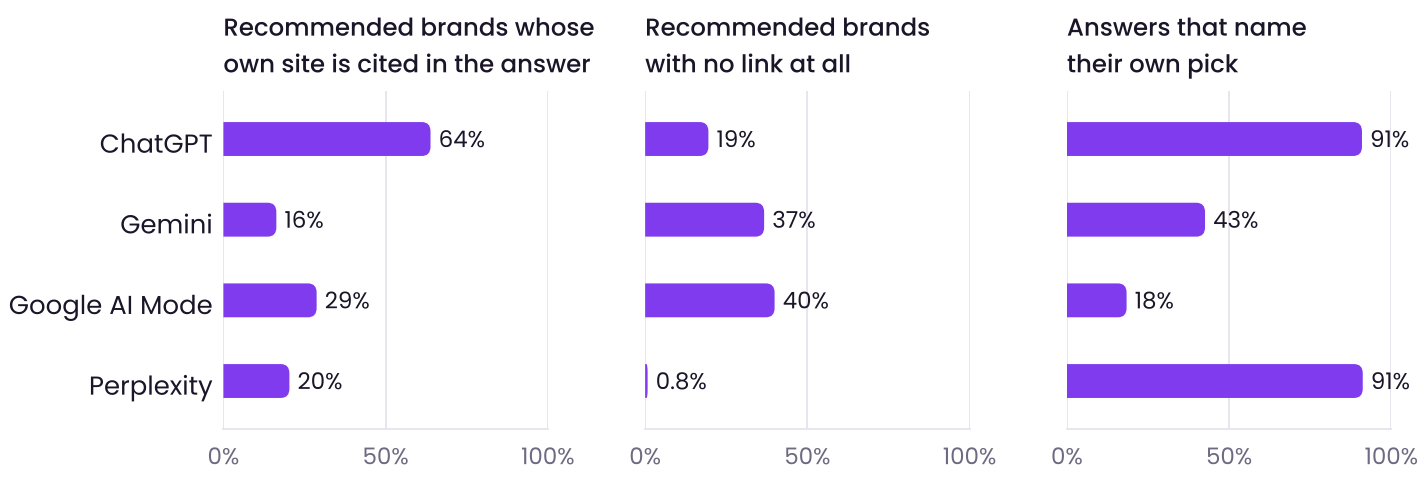
The engines are recommended at different rates. Per answer, Google AI Mode recommended 3.9 brands on average and Gemini 3.5, against 2.0 for ChatGPT and 1.4 for Perplexity. The reason is the style of the answer. ChatGPT and Perplexity name their own pick in about nine answers out of ten, while Google AI Mode does so in 18% and mostly gives a list (Figure 3).
Recommendations concentrate on a few pages. Of the 21,097 measured pages, 13,174 (62%) back exactly one recommendation, 7,923 back more than one, and 552 back ten or more. The measured pages sit on 7,369 different sites.
Where the links point (RQ3)
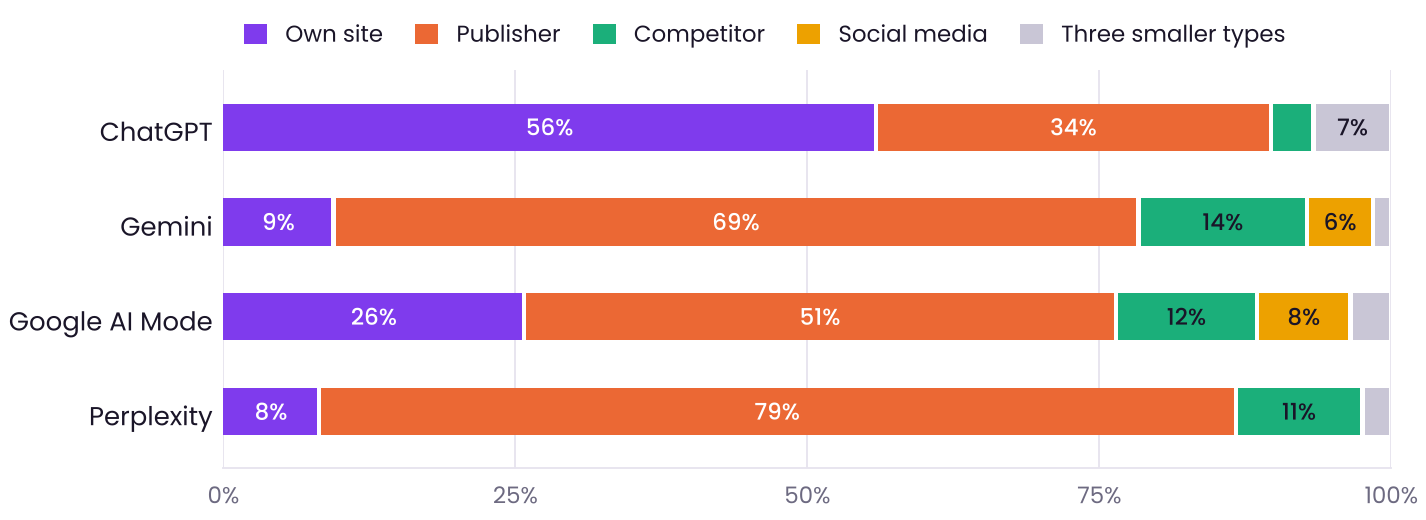
The engines differ most in whose page they link to. ChatGPT sends 56% of its links behind recommendations to the recommended brand's own site. Google AI Mode does so for 26%, Gemini for 9% and Perplexity for 8%. Perplexity and Gemini rely on publishers instead: media, magazines and blogs take 79% and 69% of their links. A competitor's page backs between 4% and 14% of recommendations, depending on the engine.
A recommended brand's own site is cited somewhere in the answer for 64% of ChatGPT's recommendations, but for only 16% to 29% on the other three engines. Many recommendations carry no link at all: 40% on Google AI Mode, 37% on Gemini and 19% on ChatGPT. Perplexity links almost every recommendation.
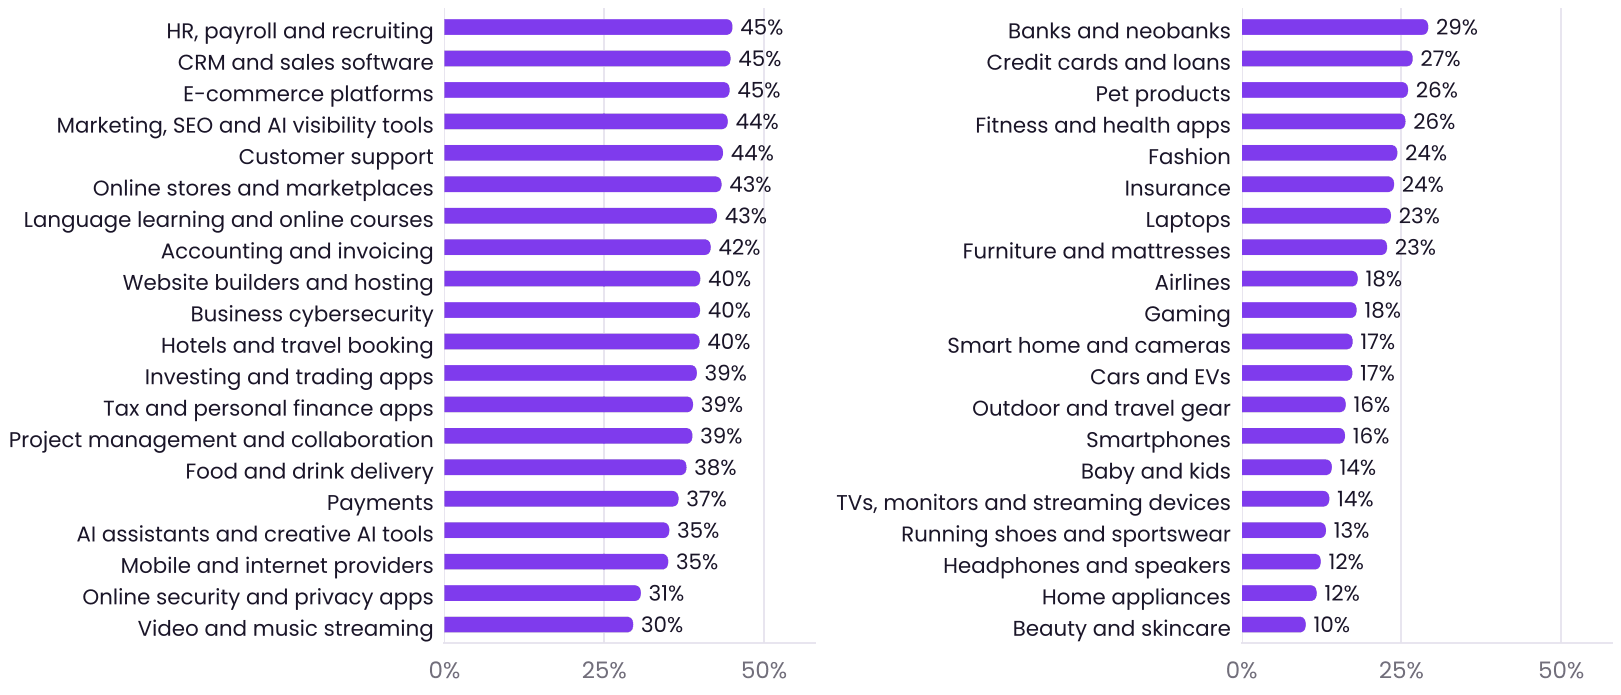
The industry matters as well. In software industries a recommended brand's own site is cited for about 40% to 45% of recommendations; in consumer goods such as beauty, home appliances and headphones it is 10% to 12% (Figure 4). Engines draw more on vendor sites for software questions and more on third-party pages for product questions.
More than half of the measured pages (54%) are listicles: pages that present several options, such as “best X” or “X alternatives”. Product pages (13%), articles (9%) and homepages (8%) follow.
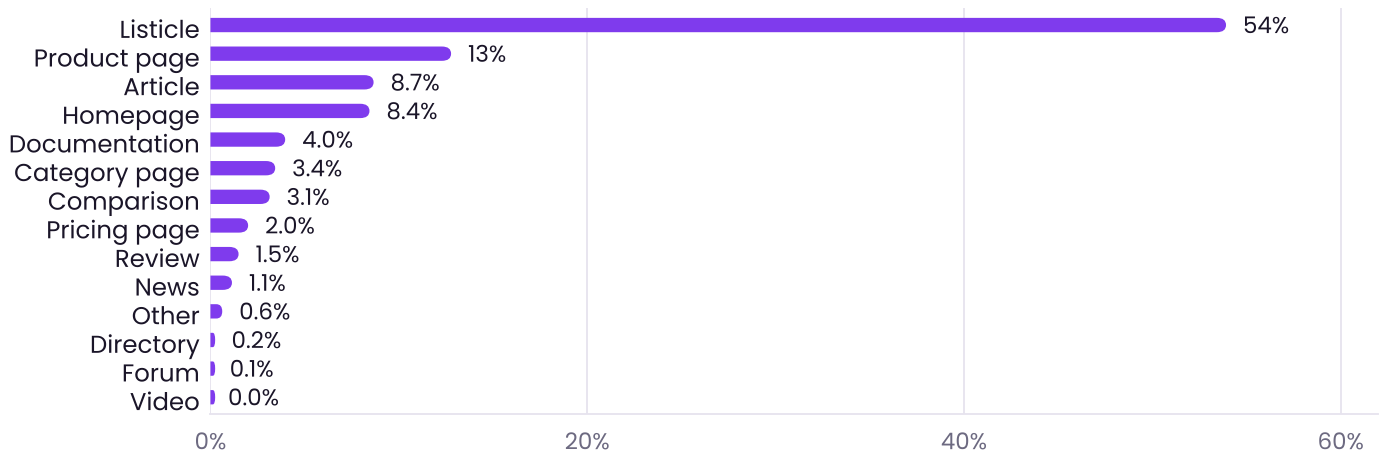
Social media is a small part of the links. 941 of the 23,137 pages behind recommendations were on social platforms, 713 of them on Reddit, and almost all came from Gemini and Google AI Mode.
Table 2. The ten sites whose pages back the most recommendations.
| Site | Pages measured | Recommendations backed |
|---|---|---|
| nerdwallet.com | 275 | 1,098 |
| pcmag.com | 230 | 1,082 |
| cnet.com | 153 | 887 |
| forbes.com | 258 | 869 |
| cnbc.com | 175 | 755 |
| rtings.com | 176 | 710 |
| nytimes.com | 132 | 604 |
| zapier.com | 63 | 436 |
| rankite.com | 228 | 420 |
| usnews.com | 115 | 281 |
nerdwallet.com
- Pages measured
- 275
- Recommendations backed
- 1,098
pcmag.com
- Pages measured
- 230
- Recommendations backed
- 1,082
cnet.com
- Pages measured
- 153
- Recommendations backed
- 887
forbes.com
- Pages measured
- 258
- Recommendations backed
- 869
cnbc.com
- Pages measured
- 175
- Recommendations backed
- 755
rtings.com
- Pages measured
- 176
- Recommendations backed
- 710
nytimes.com
- Pages measured
- 132
- Recommendations backed
- 604
zapier.com
- Pages measured
- 63
- Recommendations backed
- 436
rankite.com
- Pages measured
- 228
- Recommendations backed
- 420
usnews.com
- Pages measured
- 115
- Recommendations backed
- 281
Page measures (RQ1)
Ten of the 53 page measures kept a link to reach after correction. Seven go with more recommendations and three with fewer (Figure 6, Table 3).
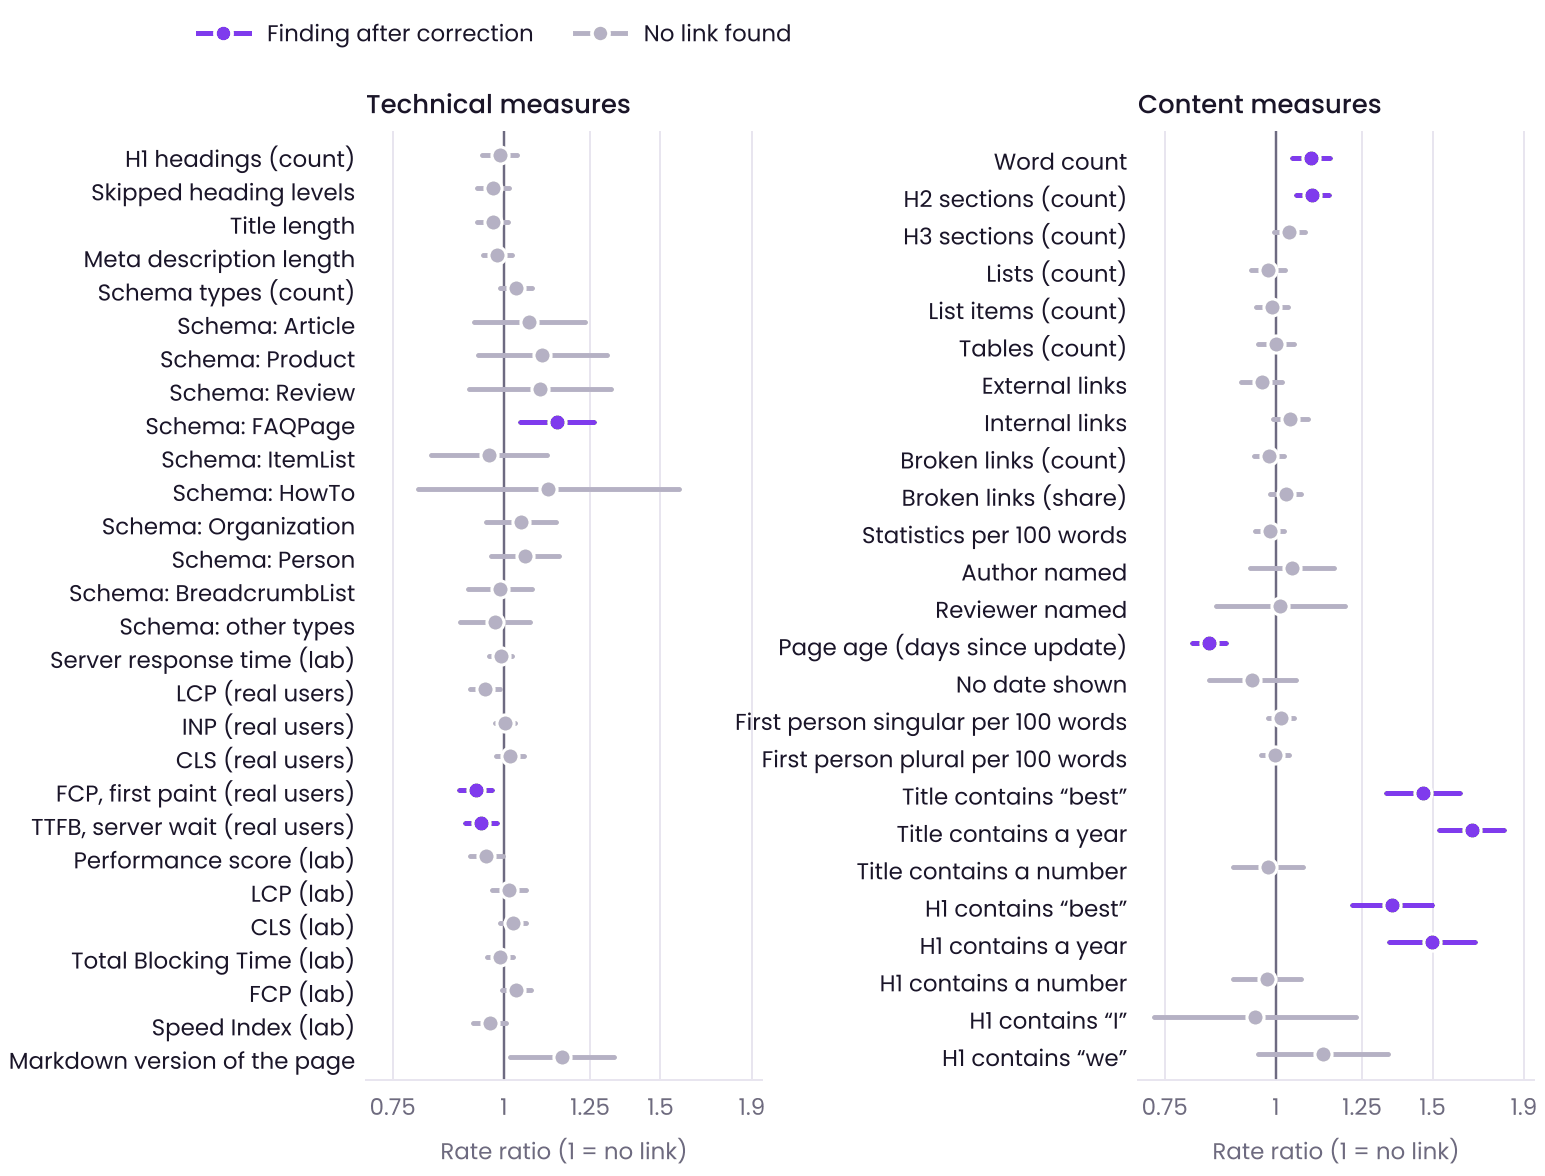
Table 3. The ten page measures that kept a link to reach after correction. For yes-or-no measures the ratio compares yes with no; for the others it is per one standard deviation.
| Measure | Rate ratio | 95% interval | Interpretation |
|---|---|---|---|
| Title contains a year | 1.66 | 1.52 to 1.81 | Pages with a year in the title back extra recommendations at 1.66 times the rate of pages without one |
| H1 contains a year | 1.50 | 1.34 to 1.67 | The same pattern for a year in the main heading |
| Title contains “best” | 1.46 | 1.33 to 1.61 | Pages titled as a “best of” back more recommendations |
| H1 contains “best” | 1.35 | 1.22 to 1.50 | The same pattern for the main heading |
| Schema: FAQPage | 1.15 | 1.04 to 1.26 | Pages with FAQ structured data back slightly more |
| H2 sections (count) | 1.10 | 1.05 to 1.15 | More sections, more recommendations (7 to 17 H2 headings) |
| Word count | 1.10 | 1.04 to 1.15 | Longer pages back more (1,840 to 4,470 words) |
| TTFB, server wait (real users) | 0.94 | 0.90 to 0.98 | A slower server goes with fewer recommendations (0.54 seconds) |
| FCP, first paint (real users) | 0.93 | 0.89 to 0.97 | A slower first paint goes with fewer (0.82 seconds) |
| Page age (days since update) | 0.84 | 0.80 to 0.88 | Older pages back fewer (about 54 to 287 days since the last update) |
Title contains a year
- Rate ratio
- 1.66
- 95% interval
- 1.52 to 1.81
- Interpretation
- Pages with a year in the title back extra recommendations at 1.66 times the rate of pages without one
H1 contains a year
- Rate ratio
- 1.50
- 95% interval
- 1.34 to 1.67
- Interpretation
- The same pattern for a year in the main heading
Title contains “best”
- Rate ratio
- 1.46
- 95% interval
- 1.33 to 1.61
- Interpretation
- Pages titled as a “best of” back more recommendations
H1 contains “best”
- Rate ratio
- 1.35
- 95% interval
- 1.22 to 1.50
- Interpretation
- The same pattern for the main heading
Schema: FAQPage
- Rate ratio
- 1.15
- 95% interval
- 1.04 to 1.26
- Interpretation
- Pages with FAQ structured data back slightly more
H2 sections (count)
- Rate ratio
- 1.10
- 95% interval
- 1.05 to 1.15
- Interpretation
- More sections, more recommendations (7 to 17 H2 headings)
Word count
- Rate ratio
- 1.10
- 95% interval
- 1.04 to 1.15
- Interpretation
- Longer pages back more (1,840 to 4,470 words)
TTFB, server wait (real users)
- Rate ratio
- 0.94
- 95% interval
- 0.90 to 0.98
- Interpretation
- A slower server goes with fewer recommendations (0.54 seconds)
FCP, first paint (real users)
- Rate ratio
- 0.93
- 95% interval
- 0.89 to 0.97
- Interpretation
- A slower first paint goes with fewer (0.82 seconds)
Page age (days since update)
- Rate ratio
- 0.84
- 95% interval
- 0.80 to 0.88
- Interpretation
- Older pages back fewer (about 54 to 287 days since the last update)
The strongest links are about what the page says it is. A year in the title or in the H1, and the word “best” in either, go with 35% to 66% higher rates. These hold with page type held equal, so they are not only an effect of listicles being cited more. Among pages with at least 200 words, 46% of those with a year in the title back more than one recommendation, against 31% of those without.
Freshness shows a second time in page age. Each step toward an older page lowers the rate by 16%. Length and structure keep smaller links, about 10% per step for word count and for H2 sections. Two speed measures from real users, time to first byte and first contentful paint, keep links of 6% to 7% per step. FAQPage structured data keeps a link of 15%.
The other 43 measures showed no link after correction. Among them are several that are often advised: a named author, a named reviewer, statistics per 100 words, first-person wording, tables and lists, external links, the number of H1 headings, and nine of the ten structured data measures. The lab speed scores showed none either. Two measures came close and are not findings: largest contentful paint from real users (rate ratio 0.95) and a markdown version of the page (1.16).
Brand on a page (RQ2)
RQ2 looks inside the page. The comparison is between brands that have the same page names for the same answer: 26,490 such groups with 234,208 brand rows, a median of 8 brands per group. On average 21% of the brands in a group were recommended by the answer.
All nine tested measures kept a link, and the links are large.
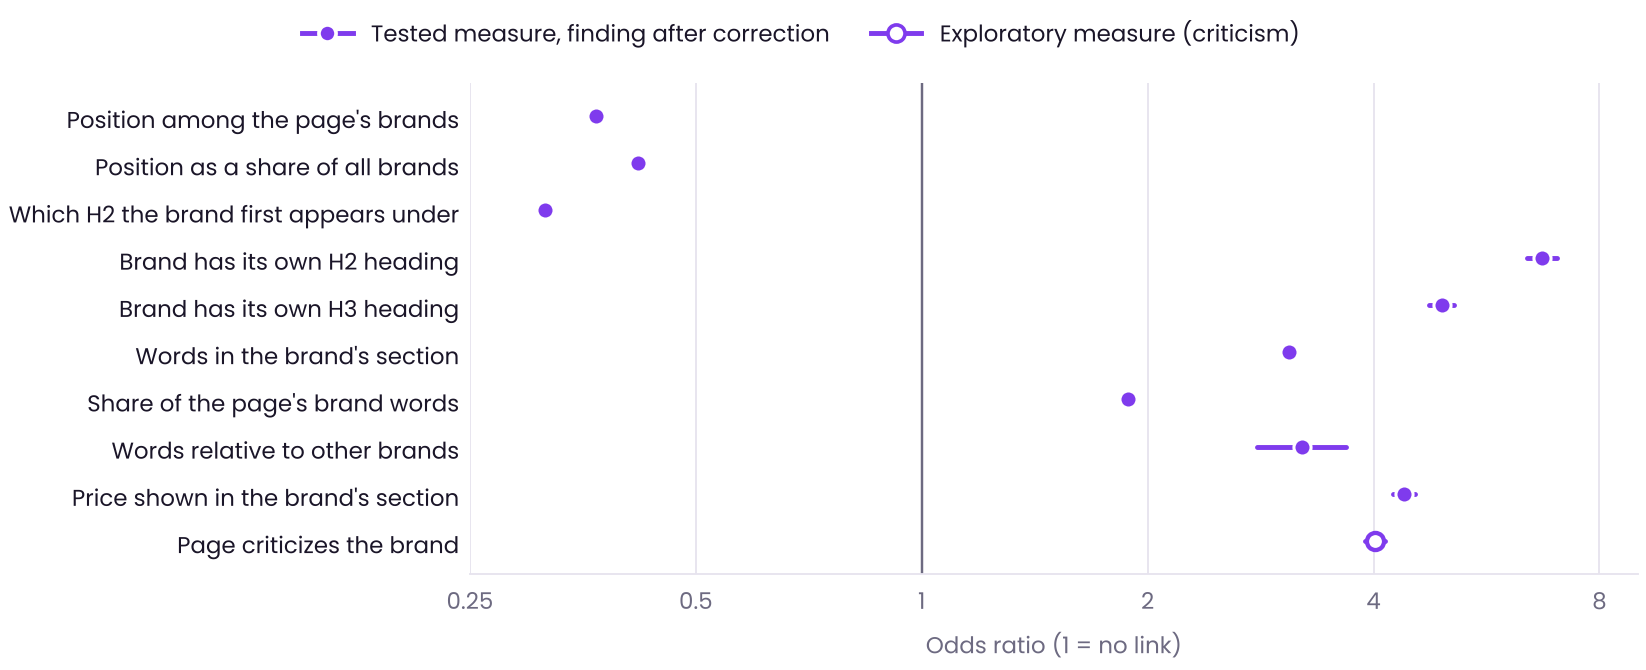
Table 4. The nine tested brand-on-page measures. Each compares brands named on the same page behind the same answer.
| Measure | Odds ratio | 95% interval | In plain words |
|---|---|---|---|
| Brand has its own H2 heading | 6.7 | 6.41 to 7.03 | A brand with its own H2 section has 6.7 times the odds of being the recommended one |
| Brand has its own H3 heading | 4.9 | 4.75 to 5.12 | The same pattern for an H3 section |
| Price shown in the brand's section | 4.4 | 4.25 to 4.54 | Brands whose section shows a price or plan are recommended more |
| Words relative to other brands | 3.2 | 2.80 to 3.68 | More words than the other brands on the page; unstable across engines |
| Words in the brand's section | 3.1 | 3.03 to 3.15 | More words in the brand's section, more often recommended |
| Share of the page's brand words | 1.9 | 1.86 to 1.91 | A larger share of the page's brand words |
| Position as a share of all brands | 0.42 | 0.41 to 0.42 | Brands named later in the page are recommended less |
| Position among the page's brands | 0.37 | 0.36 to 0.37 | The same pattern for the raw position |
| Which H2 the brand first appears under | 0.32 | 0.31 to 0.32 | Brands that first appear under a later H2 are recommended less |
Brand has its own H2 heading
- Odds ratio
- 6.7
- 95% interval
- 6.41 to 7.03
- In plain words
- A brand with its own H2 section has 6.7 times the odds of being the recommended one
Brand has its own H3 heading
- Odds ratio
- 4.9
- 95% interval
- 4.75 to 5.12
- In plain words
- The same pattern for an H3 section
Price shown in the brand's section
- Odds ratio
- 4.4
- 95% interval
- 4.25 to 4.54
- In plain words
- Brands whose section shows a price or plan are recommended more
Words relative to other brands
- Odds ratio
- 3.2
- 95% interval
- 2.80 to 3.68
- In plain words
- More words than the other brands on the page; unstable across engines
Words in the brand's section
- Odds ratio
- 3.1
- 95% interval
- 3.03 to 3.15
- In plain words
- More words in the brand's section, more often recommended
Share of the page's brand words
- Odds ratio
- 1.9
- 95% interval
- 1.86 to 1.91
- In plain words
- A larger share of the page's brand words
Position as a share of all brands
- Odds ratio
- 0.42
- 95% interval
- 0.41 to 0.42
- In plain words
- Brands named later in the page are recommended less
Position among the page's brands
- Odds ratio
- 0.37
- 95% interval
- 0.36 to 0.37
- In plain words
- The same pattern for the raw position
Which H2 the brand first appears under
- Odds ratio
- 0.32
- 95% interval
- 0.31 to 0.32
- In plain words
- Brands that first appear under a later H2 are recommended less
The brand a page names first is the recommended one in 55% of cases, and a brand named fourth or later in 12%. Brands with their own H2 section are recommended in 33% of cases against 18% for the others, and brands with a price in their section in 29% against 17%.
One measure is unstable. The ratio of a brand's words to the other brands' words has a pooled odds ratio of 3.2, but it ranges from 1.02 on Perplexity to 90 on ChatGPT, with a very wide interval there. Its direction is the same everywhere, so its size should not be relied on.
Results by engine
The thesis rule asks for the same direction on at least three engines. All ten RQ1 findings and all nine RQ2 findings point the same way on all four.
The size differs by engine. For the ten RQ1 findings, the interval excludes 1 for all ten on Google AI Mode, for 8 on Gemini, for 6 on Perplexity and for none on ChatGPT. On ChatGPT every effect has the same direction but is smaller, and its intervals include 1. The page measures therefore tell most about Google's two engines and Perplexity, and least about ChatGPT, which mostly links to brands' own sites.
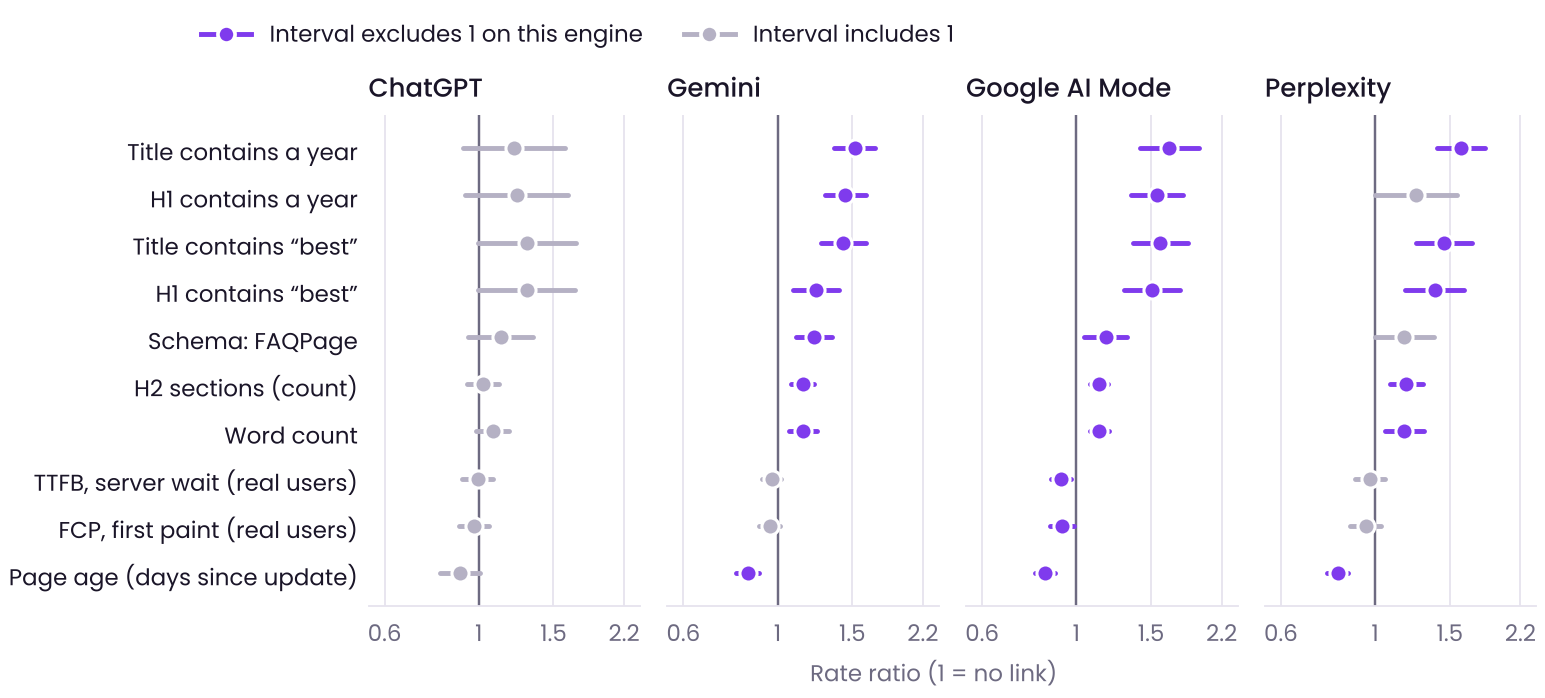
For RQ2, every tested measure has an interval that excludes 1 on every engine (Table A5).
Robustness
RQ1 was fitted again with all page measures in one model, so each measure competes with the others. Measures available for under 90% of pages (the real-user speed measures and page age) cannot enter this model, and of any two measures correlated above 0.8 one is kept, which removes “best” in the H1 in favour of “best” in the title. Of the six findings that entered, five held: word count, H2 sections (count), title contains “best”, title contains a year, H1 contains a year. FAQPage structured data did not: its rate ratio fell to 1.07 with an interval that includes 1, so its link is the weakest of the ten.
Exploratory: criticism
Brands that a page criticizes were recommended more often than the other brands on the same page: odds ratio 4.0 (95% interval 3.89 to 4.14), in the same direction on every engine. This result is exploratory. The criticism label agreed with a person's reading at only kappa 0.36 in the final check, so the label itself is unreliable, and the result is outside the correction and the thesis test. A likely reading is that pages write the most, good and bad, about the brands they cover in depth, and those are the brands the engines recommend. The study cannot confirm it.
Discussion
Under the rule fixed before collection, the thesis is supported: 19 measures kept a link to recommendations after correction, each in the same direction on all four engines. What “quality” turned out to mean is narrower than the word suggests. The page properties that go with recommendations are freshness, a title that matches the buyer's question, length, clear sections and speed. Signals of authorship and most markup showed nothing.
What this means for a website
The points below are readings of the links above.
What the study does not show
Limitations
Conclusion
Across 16,000 answers from four AI engines, the pages behind brand recommendations are not interchangeable. Pages that are fresh, say what they are in the title, cover their subject at length in clear sections and load fast back more recommendations, and within a page the brand that comes first and has its own section is the one most often recommended. The links hold in the same direction on ChatGPT, Gemini, Google AI Mode and Perplexity, though they are weakest on ChatGPT. The thesis that page quality goes with AI recommendations is supported under the pre-registered rule.
Data and code
The protocol, the 4,000 prompts, the settings, the collection workflows, the analysis script, the dataset and the result tables are public:
github.com/andrii-dolinskyi/ai-recommendation-study
How to cite. Vedeshin, A. (2026). What Makes AI Engines Recommend a Brand: A Study of 16,000 Answers. Snoika Reports.
Appendix
Table A1. Share of links behind recommendations by page owner, with 95% bootstrap intervals (1,000 resamples, clustered by prompt).
| Page owner | ChatGPT | Gemini | Google AI Mode | Perplexity |
|---|---|---|---|---|
| Own site | 55.9% (54.6 to 57.1) | 9.4% (8.8 to 10.0) | 25.8% (24.7 to 26.7) | 8.2% (7.6 to 8.8) |
| Publisher | 33.8% (32.5 to 35.1) | 68.9% (67.7 to 70.2) | 50.6% (49.2 to 52.0) | 78.5% (77.4 to 79.6) |
| Competitor | 3.6% (3.2 to 4.1) | 14.4% (13.5 to 15.4) | 12.1% (11.2 to 13.1) | 10.8% (10.1 to 11.6) |
| Social media | 0.0% (0.0 to 0.1) | 5.7% (5.1 to 6.3) | 8.0% (7.3 to 8.7) | 0.1% (0.0 to 0.1) |
| Retailer | 5.1% (4.5 to 5.7) | 0.9% (0.7 to 1.1) | 2.4% (2.0 to 2.8) | 1.3% (1.1 to 1.6) |
| Review platform | 0.7% (0.5 to 0.9) | 0.6% (0.4 to 0.8) | 0.8% (0.6 to 1.0) | 0.9% (0.7 to 1.1) |
| Other | 0.8% (0.6 to 1.1) | 0.0% (0.0 to 0.1) | 0.3% (0.2 to 0.4) | 0.1% (0.1 to 0.2) |
Own site
- ChatGPT
- 55.9% (54.6 to 57.1)
- Gemini
- 9.4% (8.8 to 10.0)
- Google AI Mode
- 25.8% (24.7 to 26.7)
- Perplexity
- 8.2% (7.6 to 8.8)
Publisher
- ChatGPT
- 33.8% (32.5 to 35.1)
- Gemini
- 68.9% (67.7 to 70.2)
- Google AI Mode
- 50.6% (49.2 to 52.0)
- Perplexity
- 78.5% (77.4 to 79.6)
Competitor
- ChatGPT
- 3.6% (3.2 to 4.1)
- Gemini
- 14.4% (13.5 to 15.4)
- Google AI Mode
- 12.1% (11.2 to 13.1)
- Perplexity
- 10.8% (10.1 to 11.6)
Social media
- ChatGPT
- 0.0% (0.0 to 0.1)
- Gemini
- 5.7% (5.1 to 6.3)
- Google AI Mode
- 8.0% (7.3 to 8.7)
- Perplexity
- 0.1% (0.0 to 0.1)
Retailer
- ChatGPT
- 5.1% (4.5 to 5.7)
- Gemini
- 0.9% (0.7 to 1.1)
- Google AI Mode
- 2.4% (2.0 to 2.8)
- Perplexity
- 1.3% (1.1 to 1.6)
Review platform
- ChatGPT
- 0.7% (0.5 to 0.9)
- Gemini
- 0.6% (0.4 to 0.8)
- Google AI Mode
- 0.8% (0.6 to 1.0)
- Perplexity
- 0.9% (0.7 to 1.1)
Other
- ChatGPT
- 0.8% (0.6 to 1.1)
- Gemini
- 0.0% (0.0 to 0.1)
- Google AI Mode
- 0.3% (0.2 to 0.4)
- Perplexity
- 0.1% (0.1 to 0.2)
Table A2. Three shares by engine, with 95% bootstrap intervals.
| Share | ChatGPT | Gemini | Google AI Mode | Perplexity |
|---|---|---|---|---|
| Recommended brands whose own site is cited anywhere in the answer | 63.8% (62.3 to 65.2) | 16.3% (15.6 to 17.1) | 28.7% (27.6 to 29.9) | 20.3% (19.1 to 21.5) |
| Recommended brands with no link | 19.5% (18.3 to 20.8) | 36.7% (35.5 to 37.9) | 39.9% (38.7 to 41.0) | 0.8% (0.4 to 1.1) |
| Answers that name their own pick | 91.0% (90.0 to 91.8) | 42.6% (41.0 to 44.1) | 18.4% (17.3 to 19.6) | 91.2% (90.3 to 92.1) |
Recommended brands whose own site is cited anywhere in the answer
- ChatGPT
- 63.8% (62.3 to 65.2)
- Gemini
- 16.3% (15.6 to 17.1)
- Google AI Mode
- 28.7% (27.6 to 29.9)
- Perplexity
- 20.3% (19.1 to 21.5)
Recommended brands with no link
- ChatGPT
- 19.5% (18.3 to 20.8)
- Gemini
- 36.7% (35.5 to 37.9)
- Google AI Mode
- 39.9% (38.7 to 41.0)
- Perplexity
- 0.8% (0.4 to 1.1)
Answers that name their own pick
- ChatGPT
- 91.0% (90.0 to 91.8)
- Gemini
- 42.6% (41.0 to 44.1)
- Google AI Mode
- 18.4% (17.3 to 19.6)
- Perplexity
- 91.2% (90.3 to 92.1)
Table A3. All 53 page measures (RQ1), pooled over the four engines. q is the p-value after Benjamini-Hochberg correction.
| Measure | Family | Pages | Rate ratio | 95% interval | p | q | Finding |
|---|---|---|---|---|---|---|---|
| H1 headings (count) | Technical | 21,095 | 0.99 | 0.95 to 1.03 | 0.635 | 0.729 | |
| Skipped heading levels | Technical | 21,095 | 0.97 | 0.93 to 1.01 | 0.201 | 0.453 | |
| Title length | Technical | 21,095 | 0.97 | 0.93 to 1.01 | 0.149 | 0.390 | |
| Meta description length | Technical | 21,095 | 0.98 | 0.95 to 1.02 | 0.387 | 0.590 | |
| Schema types (count) | Technical | 21,095 | 1.03 | 0.99 to 1.08 | 0.139 | 0.390 | |
| Schema: Article | Technical | 21,095 | 1.07 | 0.93 to 1.23 | 0.368 | 0.590 | |
| Schema: Product | Technical | 21,095 | 1.11 | 0.93 to 1.31 | 0.242 | 0.494 | |
| Schema: Review | Technical | 21,095 | 1.10 | 0.91 to 1.32 | 0.316 | 0.590 | |
| Schema: FAQPage | Technical | 21,095 | 1.15 | 1.04 to 1.26 | 0.005 | 0.026 | Yes |
| Schema: ItemList | Technical | 21,095 | 0.96 | 0.83 to 1.12 | 0.608 | 0.729 | |
| Schema: HowTo | Technical | 21,095 | 1.12 | 0.80 to 1.57 | 0.504 | 0.703 | |
| Schema: Organization | Technical | 21,095 | 1.05 | 0.96 to 1.15 | 0.329 | 0.590 | |
| Schema: Person | Technical | 21,095 | 1.06 | 0.97 to 1.15 | 0.220 | 0.466 | |
| Schema: BreadcrumbList | Technical | 21,095 | 0.99 | 0.91 to 1.08 | 0.820 | 0.870 | |
| Schema: other types | Technical | 21,095 | 0.98 | 0.89 to 1.07 | 0.622 | 0.729 | |
| Server response time (lab) | Technical | 20,908 | 0.99 | 0.96 to 1.02 | 0.594 | 0.729 | |
| LCP (real users) | Technical | 18,916 | 0.95 | 0.92 to 0.99 | 0.012 | 0.055 | |
| INP (real users) | Technical | 17,811 | 1.00 | 0.98 to 1.03 | 0.770 | 0.833 | |
| CLS (real users) | Technical | 19,009 | 1.02 | 0.98 to 1.05 | 0.372 | 0.590 | |
| FCP, first paint (real users) | Technical | 19,021 | 0.93 | 0.89 to 0.97 | <0.001 | 0.005 | Yes |
| TTFB, server wait (real users) | Technical | 18,650 | 0.94 | 0.90 to 0.98 | 0.004 | 0.025 | Yes |
| Performance score (lab) | Technical | 20,499 | 0.96 | 0.92 to 1.00 | 0.034 | 0.140 | |
| LCP (lab) | Technical | 20,503 | 1.01 | 0.97 to 1.06 | 0.541 | 0.729 | |
| CLS (lab) | Technical | 21,017 | 1.02 | 0.99 to 1.06 | 0.154 | 0.390 | |
| Total Blocking Time (lab) | Technical | 20,503 | 0.99 | 0.96 to 1.02 | 0.572 | 0.729 | |
| FCP (lab) | Technical | 20,623 | 1.03 | 1.00 to 1.07 | 0.089 | 0.317 | |
| Speed Index (lab) | Technical | 20,619 | 0.96 | 0.92 to 1.01 | 0.096 | 0.317 | |
| Markdown version of the page | Technical | 21,095 | 1.16 | 1.02 to 1.33 | 0.028 | 0.122 | |
| Word count | Content | 18,939 | 1.10 | 1.04 to 1.15 | <0.001 | 0.002 | Yes |
| H2 sections (count) | Content | 18,939 | 1.10 | 1.05 to 1.15 | <0.001 | <0.001 | Yes |
| H3 sections (count) | Content | 18,939 | 1.04 | 0.99 to 1.08 | 0.094 | 0.317 | |
| Lists (count) | Content | 18,939 | 0.98 | 0.94 to 1.02 | 0.381 | 0.590 | |
| List items (count) | Content | 18,939 | 0.99 | 0.95 to 1.03 | 0.646 | 0.729 | |
| Tables (count) | Content | 18,939 | 1.00 | 0.95 to 1.05 | 0.991 | 0.991 | |
| External links | Content | 18,939 | 0.96 | 0.91 to 1.02 | 0.168 | 0.405 | |
| Internal links | Content | 18,939 | 1.04 | 0.99 to 1.09 | 0.110 | 0.342 | |
| Broken links (count) | Content | 18,939 | 0.98 | 0.95 to 1.02 | 0.365 | 0.590 | |
| Broken links (share) | Content | 17,254 | 1.03 | 0.99 to 1.07 | 0.205 | 0.453 | |
| Statistics per 100 words | Content | 18,939 | 0.98 | 0.95 to 1.02 | 0.389 | 0.590 | |
| Author named | Content | 18,939 | 1.04 | 0.94 to 1.16 | 0.445 | 0.648 | |
| Reviewer named | Content | 18,939 | 1.01 | 0.86 to 1.20 | 0.892 | 0.916 | |
| Page age (days since update) | Content | 13,922 | 0.84 | 0.80 to 0.88 | <0.001 | <0.001 | Yes |
| No date shown | Content | 18,939 | 0.94 | 0.84 to 1.05 | 0.288 | 0.565 | |
| First person singular per 100 words | Content | 18,939 | 1.01 | 0.98 to 1.05 | 0.453 | 0.648 | |
| First person plural per 100 words | Content | 18,939 | 1.00 | 0.96 to 1.03 | 0.898 | 0.916 | |
| Title contains “best” | Content | 18,939 | 1.46 | 1.33 to 1.61 | <0.001 | <0.001 | Yes |
| Title contains a year | Content | 18,939 | 1.66 | 1.52 to 1.81 | <0.001 | <0.001 | Yes |
| Title contains a number | Content | 18,939 | 0.98 | 0.89 to 1.07 | 0.646 | 0.729 | |
| H1 contains “best” | Content | 18,939 | 1.35 | 1.22 to 1.50 | <0.001 | <0.001 | Yes |
| H1 contains a year | Content | 18,939 | 1.50 | 1.34 to 1.67 | <0.001 | <0.001 | Yes |
| H1 contains a number | Content | 18,939 | 0.98 | 0.90 to 1.07 | 0.618 | 0.729 | |
| H1 contains “I” | Content | 18,939 | 0.95 | 0.73 to 1.23 | 0.687 | 0.759 | |
| H1 contains “we” | Content | 18,939 | 1.13 | 0.96 to 1.34 | 0.154 | 0.390 |
H1 headings (count)
- Family
- Technical
- Pages
- 21,095
- Rate ratio
- 0.99
- 95% interval
- 0.95 to 1.03
- p
- 0.635
- q
- 0.729
- Finding
Skipped heading levels
- Family
- Technical
- Pages
- 21,095
- Rate ratio
- 0.97
- 95% interval
- 0.93 to 1.01
- p
- 0.201
- q
- 0.453
- Finding
Title length
- Family
- Technical
- Pages
- 21,095
- Rate ratio
- 0.97
- 95% interval
- 0.93 to 1.01
- p
- 0.149
- q
- 0.390
- Finding
Meta description length
- Family
- Technical
- Pages
- 21,095
- Rate ratio
- 0.98
- 95% interval
- 0.95 to 1.02
- p
- 0.387
- q
- 0.590
- Finding
Schema types (count)
- Family
- Technical
- Pages
- 21,095
- Rate ratio
- 1.03
- 95% interval
- 0.99 to 1.08
- p
- 0.139
- q
- 0.390
- Finding
Schema: Article
- Family
- Technical
- Pages
- 21,095
- Rate ratio
- 1.07
- 95% interval
- 0.93 to 1.23
- p
- 0.368
- q
- 0.590
- Finding
Schema: Product
- Family
- Technical
- Pages
- 21,095
- Rate ratio
- 1.11
- 95% interval
- 0.93 to 1.31
- p
- 0.242
- q
- 0.494
- Finding
Schema: Review
- Family
- Technical
- Pages
- 21,095
- Rate ratio
- 1.10
- 95% interval
- 0.91 to 1.32
- p
- 0.316
- q
- 0.590
- Finding
Schema: FAQPage
- Family
- Technical
- Pages
- 21,095
- Rate ratio
- 1.15
- 95% interval
- 1.04 to 1.26
- p
- 0.005
- q
- 0.026
- Finding
- Yes
Schema: ItemList
- Family
- Technical
- Pages
- 21,095
- Rate ratio
- 0.96
- 95% interval
- 0.83 to 1.12
- p
- 0.608
- q
- 0.729
- Finding
Schema: HowTo
- Family
- Technical
- Pages
- 21,095
- Rate ratio
- 1.12
- 95% interval
- 0.80 to 1.57
- p
- 0.504
- q
- 0.703
- Finding
Schema: Organization
- Family
- Technical
- Pages
- 21,095
- Rate ratio
- 1.05
- 95% interval
- 0.96 to 1.15
- p
- 0.329
- q
- 0.590
- Finding
Schema: Person
- Family
- Technical
- Pages
- 21,095
- Rate ratio
- 1.06
- 95% interval
- 0.97 to 1.15
- p
- 0.220
- q
- 0.466
- Finding
Schema: BreadcrumbList
- Family
- Technical
- Pages
- 21,095
- Rate ratio
- 0.99
- 95% interval
- 0.91 to 1.08
- p
- 0.820
- q
- 0.870
- Finding
Schema: other types
- Family
- Technical
- Pages
- 21,095
- Rate ratio
- 0.98
- 95% interval
- 0.89 to 1.07
- p
- 0.622
- q
- 0.729
- Finding
Server response time (lab)
- Family
- Technical
- Pages
- 20,908
- Rate ratio
- 0.99
- 95% interval
- 0.96 to 1.02
- p
- 0.594
- q
- 0.729
- Finding
LCP (real users)
- Family
- Technical
- Pages
- 18,916
- Rate ratio
- 0.95
- 95% interval
- 0.92 to 0.99
- p
- 0.012
- q
- 0.055
- Finding
INP (real users)
- Family
- Technical
- Pages
- 17,811
- Rate ratio
- 1.00
- 95% interval
- 0.98 to 1.03
- p
- 0.770
- q
- 0.833
- Finding
CLS (real users)
- Family
- Technical
- Pages
- 19,009
- Rate ratio
- 1.02
- 95% interval
- 0.98 to 1.05
- p
- 0.372
- q
- 0.590
- Finding
FCP, first paint (real users)
- Family
- Technical
- Pages
- 19,021
- Rate ratio
- 0.93
- 95% interval
- 0.89 to 0.97
- p
- <0.001
- q
- 0.005
- Finding
- Yes
TTFB, server wait (real users)
- Family
- Technical
- Pages
- 18,650
- Rate ratio
- 0.94
- 95% interval
- 0.90 to 0.98
- p
- 0.004
- q
- 0.025
- Finding
- Yes
Performance score (lab)
- Family
- Technical
- Pages
- 20,499
- Rate ratio
- 0.96
- 95% interval
- 0.92 to 1.00
- p
- 0.034
- q
- 0.140
- Finding
LCP (lab)
- Family
- Technical
- Pages
- 20,503
- Rate ratio
- 1.01
- 95% interval
- 0.97 to 1.06
- p
- 0.541
- q
- 0.729
- Finding
CLS (lab)
- Family
- Technical
- Pages
- 21,017
- Rate ratio
- 1.02
- 95% interval
- 0.99 to 1.06
- p
- 0.154
- q
- 0.390
- Finding
Total Blocking Time (lab)
- Family
- Technical
- Pages
- 20,503
- Rate ratio
- 0.99
- 95% interval
- 0.96 to 1.02
- p
- 0.572
- q
- 0.729
- Finding
FCP (lab)
- Family
- Technical
- Pages
- 20,623
- Rate ratio
- 1.03
- 95% interval
- 1.00 to 1.07
- p
- 0.089
- q
- 0.317
- Finding
Speed Index (lab)
- Family
- Technical
- Pages
- 20,619
- Rate ratio
- 0.96
- 95% interval
- 0.92 to 1.01
- p
- 0.096
- q
- 0.317
- Finding
Markdown version of the page
- Family
- Technical
- Pages
- 21,095
- Rate ratio
- 1.16
- 95% interval
- 1.02 to 1.33
- p
- 0.028
- q
- 0.122
- Finding
Word count
- Family
- Content
- Pages
- 18,939
- Rate ratio
- 1.10
- 95% interval
- 1.04 to 1.15
- p
- <0.001
- q
- 0.002
- Finding
- Yes
H2 sections (count)
- Family
- Content
- Pages
- 18,939
- Rate ratio
- 1.10
- 95% interval
- 1.05 to 1.15
- p
- <0.001
- q
- <0.001
- Finding
- Yes
H3 sections (count)
- Family
- Content
- Pages
- 18,939
- Rate ratio
- 1.04
- 95% interval
- 0.99 to 1.08
- p
- 0.094
- q
- 0.317
- Finding
Lists (count)
- Family
- Content
- Pages
- 18,939
- Rate ratio
- 0.98
- 95% interval
- 0.94 to 1.02
- p
- 0.381
- q
- 0.590
- Finding
List items (count)
- Family
- Content
- Pages
- 18,939
- Rate ratio
- 0.99
- 95% interval
- 0.95 to 1.03
- p
- 0.646
- q
- 0.729
- Finding
Tables (count)
- Family
- Content
- Pages
- 18,939
- Rate ratio
- 1.00
- 95% interval
- 0.95 to 1.05
- p
- 0.991
- q
- 0.991
- Finding
External links
- Family
- Content
- Pages
- 18,939
- Rate ratio
- 0.96
- 95% interval
- 0.91 to 1.02
- p
- 0.168
- q
- 0.405
- Finding
Internal links
- Family
- Content
- Pages
- 18,939
- Rate ratio
- 1.04
- 95% interval
- 0.99 to 1.09
- p
- 0.110
- q
- 0.342
- Finding
Broken links (count)
- Family
- Content
- Pages
- 18,939
- Rate ratio
- 0.98
- 95% interval
- 0.95 to 1.02
- p
- 0.365
- q
- 0.590
- Finding
Broken links (share)
- Family
- Content
- Pages
- 17,254
- Rate ratio
- 1.03
- 95% interval
- 0.99 to 1.07
- p
- 0.205
- q
- 0.453
- Finding
Statistics per 100 words
- Family
- Content
- Pages
- 18,939
- Rate ratio
- 0.98
- 95% interval
- 0.95 to 1.02
- p
- 0.389
- q
- 0.590
- Finding
Author named
- Family
- Content
- Pages
- 18,939
- Rate ratio
- 1.04
- 95% interval
- 0.94 to 1.16
- p
- 0.445
- q
- 0.648
- Finding
Reviewer named
- Family
- Content
- Pages
- 18,939
- Rate ratio
- 1.01
- 95% interval
- 0.86 to 1.20
- p
- 0.892
- q
- 0.916
- Finding
Page age (days since update)
- Family
- Content
- Pages
- 13,922
- Rate ratio
- 0.84
- 95% interval
- 0.80 to 0.88
- p
- <0.001
- q
- <0.001
- Finding
- Yes
No date shown
- Family
- Content
- Pages
- 18,939
- Rate ratio
- 0.94
- 95% interval
- 0.84 to 1.05
- p
- 0.288
- q
- 0.565
- Finding
First person singular per 100 words
- Family
- Content
- Pages
- 18,939
- Rate ratio
- 1.01
- 95% interval
- 0.98 to 1.05
- p
- 0.453
- q
- 0.648
- Finding
First person plural per 100 words
- Family
- Content
- Pages
- 18,939
- Rate ratio
- 1.00
- 95% interval
- 0.96 to 1.03
- p
- 0.898
- q
- 0.916
- Finding
Title contains “best”
- Family
- Content
- Pages
- 18,939
- Rate ratio
- 1.46
- 95% interval
- 1.33 to 1.61
- p
- <0.001
- q
- <0.001
- Finding
- Yes
Title contains a year
- Family
- Content
- Pages
- 18,939
- Rate ratio
- 1.66
- 95% interval
- 1.52 to 1.81
- p
- <0.001
- q
- <0.001
- Finding
- Yes
Title contains a number
- Family
- Content
- Pages
- 18,939
- Rate ratio
- 0.98
- 95% interval
- 0.89 to 1.07
- p
- 0.646
- q
- 0.729
- Finding
H1 contains “best”
- Family
- Content
- Pages
- 18,939
- Rate ratio
- 1.35
- 95% interval
- 1.22 to 1.50
- p
- <0.001
- q
- <0.001
- Finding
- Yes
H1 contains a year
- Family
- Content
- Pages
- 18,939
- Rate ratio
- 1.50
- 95% interval
- 1.34 to 1.67
- p
- <0.001
- q
- <0.001
- Finding
- Yes
H1 contains a number
- Family
- Content
- Pages
- 18,939
- Rate ratio
- 0.98
- 95% interval
- 0.90 to 1.07
- p
- 0.618
- q
- 0.729
- Finding
H1 contains “I”
- Family
- Content
- Pages
- 18,939
- Rate ratio
- 0.95
- 95% interval
- 0.73 to 1.23
- p
- 0.687
- q
- 0.759
- Finding
H1 contains “we”
- Family
- Content
- Pages
- 18,939
- Rate ratio
- 1.13
- 95% interval
- 0.96 to 1.34
- p
- 0.154
- q
- 0.390
- Finding
Table A4. The ten RQ1 findings on each engine: rate ratio with 95% interval. Grey values have an interval that includes 1.
| Measure | ChatGPT | Gemini | Google AI Mode | Perplexity |
|---|---|---|---|---|
| Title contains a year | 1.21 (0.92 to 1.59) | 1.52 (1.36 to 1.70) | 1.66 (1.41 to 1.95) | 1.59 (1.40 to 1.81) |
| H1 contains a year | 1.23 (0.93 to 1.62) | 1.45 (1.29 to 1.61) | 1.55 (1.34 to 1.79) | 1.25 (1.00 to 1.56) |
| Title contains “best” | 1.30 (1.00 to 1.69) | 1.43 (1.26 to 1.61) | 1.58 (1.36 to 1.83) | 1.46 (1.25 to 1.69) |
| H1 contains “best” | 1.30 (1.00 to 1.69) | 1.23 (1.09 to 1.39) | 1.51 (1.30 to 1.75) | 1.38 (1.18 to 1.62) |
| Schema: FAQPage | 1.13 (0.95 to 1.35) | 1.22 (1.10 to 1.34) | 1.17 (1.05 to 1.31) | 1.17 (1.00 to 1.38) |
| H2 sections (count) | 1.02 (0.94 to 1.12) | 1.15 (1.08 to 1.22) | 1.13 (1.08 to 1.19) | 1.19 (1.08 to 1.30) |
| Word count | 1.08 (0.99 to 1.18) | 1.15 (1.06 to 1.24) | 1.13 (1.07 to 1.19) | 1.17 (1.05 to 1.30) |
| TTFB, server wait (real users) | 0.99 (0.91 to 1.08) | 0.97 (0.92 to 1.02) | 0.92 (0.87 to 0.97) | 0.97 (0.90 to 1.06) |
| FCP, first paint (real users) | 0.97 (0.90 to 1.06) | 0.96 (0.91 to 1.01) | 0.93 (0.87 to 0.99) | 0.95 (0.88 to 1.03) |
| Page age (days since update) | 0.90 (0.81 to 1.01) | 0.85 (0.80 to 0.91) | 0.84 (0.80 to 0.89) | 0.82 (0.77 to 0.86) |
Title contains a year
- ChatGPT
- 1.21 (0.92 to 1.59)
- Gemini
- 1.52 (1.36 to 1.70)
- Google AI Mode
- 1.66 (1.41 to 1.95)
- Perplexity
- 1.59 (1.40 to 1.81)
H1 contains a year
- ChatGPT
- 1.23 (0.93 to 1.62)
- Gemini
- 1.45 (1.29 to 1.61)
- Google AI Mode
- 1.55 (1.34 to 1.79)
- Perplexity
- 1.25 (1.00 to 1.56)
Title contains “best”
- ChatGPT
- 1.30 (1.00 to 1.69)
- Gemini
- 1.43 (1.26 to 1.61)
- Google AI Mode
- 1.58 (1.36 to 1.83)
- Perplexity
- 1.46 (1.25 to 1.69)
H1 contains “best”
- ChatGPT
- 1.30 (1.00 to 1.69)
- Gemini
- 1.23 (1.09 to 1.39)
- Google AI Mode
- 1.51 (1.30 to 1.75)
- Perplexity
- 1.38 (1.18 to 1.62)
Schema: FAQPage
- ChatGPT
- 1.13 (0.95 to 1.35)
- Gemini
- 1.22 (1.10 to 1.34)
- Google AI Mode
- 1.17 (1.05 to 1.31)
- Perplexity
- 1.17 (1.00 to 1.38)
H2 sections (count)
- ChatGPT
- 1.02 (0.94 to 1.12)
- Gemini
- 1.15 (1.08 to 1.22)
- Google AI Mode
- 1.13 (1.08 to 1.19)
- Perplexity
- 1.19 (1.08 to 1.30)
Word count
- ChatGPT
- 1.08 (0.99 to 1.18)
- Gemini
- 1.15 (1.06 to 1.24)
- Google AI Mode
- 1.13 (1.07 to 1.19)
- Perplexity
- 1.17 (1.05 to 1.30)
TTFB, server wait (real users)
- ChatGPT
- 0.99 (0.91 to 1.08)
- Gemini
- 0.97 (0.92 to 1.02)
- Google AI Mode
- 0.92 (0.87 to 0.97)
- Perplexity
- 0.97 (0.90 to 1.06)
FCP, first paint (real users)
- ChatGPT
- 0.97 (0.90 to 1.06)
- Gemini
- 0.96 (0.91 to 1.01)
- Google AI Mode
- 0.93 (0.87 to 0.99)
- Perplexity
- 0.95 (0.88 to 1.03)
Page age (days since update)
- ChatGPT
- 0.90 (0.81 to 1.01)
- Gemini
- 0.85 (0.80 to 0.91)
- Google AI Mode
- 0.84 (0.80 to 0.89)
- Perplexity
- 0.82 (0.77 to 0.86)
Table A5. Brand-on-page measures (RQ2) on each engine: odds ratio with 95% interval.
| Measure | ChatGPT | Gemini | Google AI Mode | Perplexity |
|---|---|---|---|---|
| Position among the page's brands | 0.28 (0.27 to 0.30) | 0.41 (0.40 to 0.42) | 0.37 (0.36 to 0.38) | 0.37 (0.37 to 0.38) |
| Position as a share of all brands | 0.36 (0.35 to 0.38) | 0.45 (0.44 to 0.46) | 0.44 (0.43 to 0.46) | 0.40 (0.39 to 0.41) |
| Which H2 the brand first appears under | 0.26 (0.25 to 0.27) | 0.36 (0.35 to 0.38) | 0.33 (0.31 to 0.34) | 0.30 (0.29 to 0.31) |
| Brand has its own H2 heading | 10.07 (9.04 to 11.22) | 5.55 (5.08 to 6.06) | 6.60 (6.02 to 7.25) | 6.06 (5.56 to 6.60) |
| Brand has its own H3 heading | 3.51 (3.19 to 3.87) | 5.52 (5.15 to 5.91) | 5.16 (4.77 to 5.58) | 5.00 (4.66 to 5.37) |
| Words in the brand's section | 3.41 (3.24 to 3.59) | 2.96 (2.86 to 3.06) | 3.06 (2.95 to 3.18) | 2.99 (2.88 to 3.10) |
| Share of the page's brand words | 2.09 (2.02 to 2.17) | 2.04 (1.98 to 2.10) | 2.23 (2.14 to 2.33) | 1.62 (1.59 to 1.66) |
| Words relative to other brands | 90.10 (39.00 to 208.16) | 2.83 (2.66 to 3.01) | 4.32 (3.87 to 4.81) | 1.02 (1.00 to 1.03) |
| Price shown in the brand's section | 5.34 (4.84 to 5.88) | 4.53 (4.27 to 4.80) | 4.72 (4.40 to 5.07) | 3.80 (3.59 to 4.02) |
| Page criticizes the brand (exploratory) | 3.58 (3.29 to 3.90) | 4.04 (3.83 to 4.27) | 4.53 (4.24 to 4.85) | 3.86 (3.65 to 4.08) |
Position among the page's brands
- ChatGPT
- 0.28 (0.27 to 0.30)
- Gemini
- 0.41 (0.40 to 0.42)
- Google AI Mode
- 0.37 (0.36 to 0.38)
- Perplexity
- 0.37 (0.37 to 0.38)
Position as a share of all brands
- ChatGPT
- 0.36 (0.35 to 0.38)
- Gemini
- 0.45 (0.44 to 0.46)
- Google AI Mode
- 0.44 (0.43 to 0.46)
- Perplexity
- 0.40 (0.39 to 0.41)
Which H2 the brand first appears under
- ChatGPT
- 0.26 (0.25 to 0.27)
- Gemini
- 0.36 (0.35 to 0.38)
- Google AI Mode
- 0.33 (0.31 to 0.34)
- Perplexity
- 0.30 (0.29 to 0.31)
Brand has its own H2 heading
- ChatGPT
- 10.07 (9.04 to 11.22)
- Gemini
- 5.55 (5.08 to 6.06)
- Google AI Mode
- 6.60 (6.02 to 7.25)
- Perplexity
- 6.06 (5.56 to 6.60)
Brand has its own H3 heading
- ChatGPT
- 3.51 (3.19 to 3.87)
- Gemini
- 5.52 (5.15 to 5.91)
- Google AI Mode
- 5.16 (4.77 to 5.58)
- Perplexity
- 5.00 (4.66 to 5.37)
Words in the brand's section
- ChatGPT
- 3.41 (3.24 to 3.59)
- Gemini
- 2.96 (2.86 to 3.06)
- Google AI Mode
- 3.06 (2.95 to 3.18)
- Perplexity
- 2.99 (2.88 to 3.10)
Share of the page's brand words
- ChatGPT
- 2.09 (2.02 to 2.17)
- Gemini
- 2.04 (1.98 to 2.10)
- Google AI Mode
- 2.23 (2.14 to 2.33)
- Perplexity
- 1.62 (1.59 to 1.66)
Words relative to other brands
- ChatGPT
- 90.10 (39.00 to 208.16)
- Gemini
- 2.83 (2.66 to 3.01)
- Google AI Mode
- 4.32 (3.87 to 4.81)
- Perplexity
- 1.02 (1.00 to 1.03)
Price shown in the brand's section
- ChatGPT
- 5.34 (4.84 to 5.88)
- Gemini
- 4.53 (4.27 to 4.80)
- Google AI Mode
- 4.72 (4.40 to 5.07)
- Perplexity
- 3.80 (3.59 to 4.02)
Page criticizes the brand (exploratory)
- ChatGPT
- 3.58 (3.29 to 3.90)
- Gemini
- 4.04 (3.83 to 4.27)
- Google AI Mode
- 4.53 (4.24 to 4.85)
- Perplexity
- 3.86 (3.65 to 4.08)
Table A6. Robustness: the RQ1 findings that could enter the single model with all page measures (16,699 pages, 45 measures).
| Measure | Rate ratio, all measures in one model | 95% interval |
|---|---|---|
| Schema: FAQPage | 1.07 | 0.97 to 1.18 |
| Word count | 1.10 | 1.03 to 1.17 |
| H2 sections (count) | 1.07 | 1.03 to 1.12 |
| Title contains “best” | 1.24 | 1.13 to 1.37 |
| Title contains a year | 1.39 | 1.24 to 1.57 |
| H1 contains a year | 1.20 | 1.07 to 1.34 |
Schema: FAQPage
- Rate ratio, all measures in one model
- 1.07
- 95% interval
- 0.97 to 1.18
Word count
- Rate ratio, all measures in one model
- 1.10
- 95% interval
- 1.03 to 1.17
H2 sections (count)
- Rate ratio, all measures in one model
- 1.07
- 95% interval
- 1.03 to 1.12
Title contains “best”
- Rate ratio, all measures in one model
- 1.24
- 95% interval
- 1.13 to 1.37
Title contains a year
- Rate ratio, all measures in one model
- 1.39
- 95% interval
- 1.24 to 1.57
H1 contains a year
- Rate ratio, all measures in one model
- 1.20
- 95% interval
- 1.07 to 1.34
Table A7. Median and quartiles of every numeric page measure. Times are in seconds unless the name says otherwise.
| Measure | Pages | 25% | Median | 75% |
|---|---|---|---|---|
| H1 headings (count) | 21,097 | 1.00 | 1.00 | 1.00 |
| Skipped heading levels | 21,097 | 0.00 | 0.00 | 1.00 |
| Title length | 21,097 | 48.0 | 57.0 | 67.0 |
| Meta description length | 21,097 | 131 | 148 | 159 |
| Schema types (count) | 21,097 | 4.00 | 9.00 | 12.0 |
| Server response time (lab) | 20,910 | 6.00 | 15.0 | 68.0 |
| LCP (real users) | 18,918 | 1.58 | 2.05 | 2.69 |
| INP (real users) | 17,813 | 127 | 171 | 228 |
| CLS (real users) | 19,011 | 0.00 | 0.02 | 0.06 |
| FCP, first paint (real users) | 19,023 | 1.32 | 1.73 | 2.26 |
| TTFB, server wait (real users) | 18,652 | 0.63 | 0.86 | 1.23 |
| Performance score (lab) | 20,501 | 42.0 | 61.0 | 82.0 |
| LCP (lab) | 20,505 | 2.38 | 5.38 | 10.9 |
| CLS (lab) | 21,019 | 0.00 | 0.00 | 0.04 |
| Total Blocking Time (lab) | 20,505 | 136 | 536 | 1,383 |
| FCP (lab) | 20,625 | 1.35 | 1.99 | 2.90 |
| Speed Index (lab) | 20,621 | 3.63 | 5.77 | 8.71 |
| Word count | 21,097 | 718 | 1,785 | 3,278 |
| H2 sections (count) | 21,097 | 3.00 | 7.00 | 12.0 |
| H3 sections (count) | 21,097 | 1.00 | 8.00 | 16.0 |
| Lists (count) | 21,097 | 1.00 | 4.00 | 13.0 |
| List items (count) | 21,097 | 3.00 | 17.0 | 50.0 |
| Tables (count) | 21,097 | 0.00 | 0.00 | 1.00 |
| External links | 21,097 | 0.00 | 2.00 | 12.0 |
| Internal links | 21,097 | 5.00 | 15.0 | 32.0 |
| Broken links (count) | 21,097 | 0.00 | 0.00 | 0.00 |
| Broken links (share) | 18,184 | 0.00 | 0.00 | 0.00 |
| Statistics per 100 words | 20,509 | 0.95 | 2.11 | 3.93 |
| Page age (days since update) | 14,899 | 16.0 | 59.0 | 182 |
| First person singular per 100 words | 20,509 | 0.00 | 0.05 | 0.29 |
| First person plural per 100 words | 20,509 | 0.09 | 0.38 | 0.90 |
H1 headings (count)
- Pages
- 21,097
- 25%
- 1.00
- Median
- 1.00
- 75%
- 1.00
Skipped heading levels
- Pages
- 21,097
- 25%
- 0.00
- Median
- 0.00
- 75%
- 1.00
Title length
- Pages
- 21,097
- 25%
- 48.0
- Median
- 57.0
- 75%
- 67.0
Meta description length
- Pages
- 21,097
- 25%
- 131
- Median
- 148
- 75%
- 159
Schema types (count)
- Pages
- 21,097
- 25%
- 4.00
- Median
- 9.00
- 75%
- 12.0
Server response time (lab)
- Pages
- 20,910
- 25%
- 6.00
- Median
- 15.0
- 75%
- 68.0
LCP (real users)
- Pages
- 18,918
- 25%
- 1.58
- Median
- 2.05
- 75%
- 2.69
INP (real users)
- Pages
- 17,813
- 25%
- 127
- Median
- 171
- 75%
- 228
CLS (real users)
- Pages
- 19,011
- 25%
- 0.00
- Median
- 0.02
- 75%
- 0.06
FCP, first paint (real users)
- Pages
- 19,023
- 25%
- 1.32
- Median
- 1.73
- 75%
- 2.26
TTFB, server wait (real users)
- Pages
- 18,652
- 25%
- 0.63
- Median
- 0.86
- 75%
- 1.23
Performance score (lab)
- Pages
- 20,501
- 25%
- 42.0
- Median
- 61.0
- 75%
- 82.0
LCP (lab)
- Pages
- 20,505
- 25%
- 2.38
- Median
- 5.38
- 75%
- 10.9
CLS (lab)
- Pages
- 21,019
- 25%
- 0.00
- Median
- 0.00
- 75%
- 0.04
Total Blocking Time (lab)
- Pages
- 20,505
- 25%
- 136
- Median
- 536
- 75%
- 1,383
FCP (lab)
- Pages
- 20,625
- 25%
- 1.35
- Median
- 1.99
- 75%
- 2.90
Speed Index (lab)
- Pages
- 20,621
- 25%
- 3.63
- Median
- 5.77
- 75%
- 8.71
Word count
- Pages
- 21,097
- 25%
- 718
- Median
- 1,785
- 75%
- 3,278
H2 sections (count)
- Pages
- 21,097
- 25%
- 3.00
- Median
- 7.00
- 75%
- 12.0
H3 sections (count)
- Pages
- 21,097
- 25%
- 1.00
- Median
- 8.00
- 75%
- 16.0
Lists (count)
- Pages
- 21,097
- 25%
- 1.00
- Median
- 4.00
- 75%
- 13.0
List items (count)
- Pages
- 21,097
- 25%
- 3.00
- Median
- 17.0
- 75%
- 50.0
Tables (count)
- Pages
- 21,097
- 25%
- 0.00
- Median
- 0.00
- 75%
- 1.00
External links
- Pages
- 21,097
- 25%
- 0.00
- Median
- 2.00
- 75%
- 12.0
Internal links
- Pages
- 21,097
- 25%
- 5.00
- Median
- 15.0
- 75%
- 32.0
Broken links (count)
- Pages
- 21,097
- 25%
- 0.00
- Median
- 0.00
- 75%
- 0.00
Broken links (share)
- Pages
- 18,184
- 25%
- 0.00
- Median
- 0.00
- 75%
- 0.00
Statistics per 100 words
- Pages
- 20,509
- 25%
- 0.95
- Median
- 2.11
- 75%
- 3.93
Page age (days since update)
- Pages
- 14,899
- 25%
- 16.0
- Median
- 59.0
- 75%
- 182
First person singular per 100 words
- Pages
- 20,509
- 25%
- 0.00
- Median
- 0.05
- 75%
- 0.29
First person plural per 100 words
- Pages
- 20,509
- 25%
- 0.09
- Median
- 0.38
- 75%
- 0.90
Table A8. Share of measured pages with each of the main yes-or-no properties.
| Yes-or-no measure | Share of measured pages |
|---|---|
| Author named | 78% |
| Title contains “best” | 49% |
| Title contains a year | 45% |
| H1 contains “best” | 46% |
| H1 contains a year | 37% |
| Schema: FAQPage | 35% |
| No date shown | 29% |
| Markdown version of the page | 9% |
| Reviewer named | 8% |
Author named
- Share of measured pages
- 78%
Title contains “best”
- Share of measured pages
- 49%
Title contains a year
- Share of measured pages
- 45%
H1 contains “best”
- Share of measured pages
- 46%
H1 contains a year
- Share of measured pages
- 37%
Schema: FAQPage
- Share of measured pages
- 35%
No date shown
- Share of measured pages
- 29%
Markdown version of the page
- Share of measured pages
- 9%
Reviewer named
- Share of measured pages
- 8%
Table A9. Social media pages behind recommendations, counted and left out of the page measures.
| Platform | Pages behind recommendations |
|---|---|
| reddit.com | 713 |
| youtube.com | 114 |
| facebook.com | 54 |
| medium.com | 25 |
| linkedin.com | 17 |
| instagram.com | 11 |
| tiktok.com | 6 |
| pinterest.com | 1 |
reddit.com
- Pages behind recommendations
- 713
youtube.com
- Pages behind recommendations
- 114
facebook.com
- Pages behind recommendations
- 54
medium.com
- Pages behind recommendations
- 25
linkedin.com
- Pages behind recommendations
- 17
instagram.com
- Pages behind recommendations
- 11
tiktok.com
- Pages behind recommendations
- 6
pinterest.com
- Pages behind recommendations
- 1
More reports
All reportsSee how AI talks about your brand