AI overview tracking: how to measure visibility and impact

Content authorJevgenia Pogadajeva, MBA, MScPublished onReading time9 min read
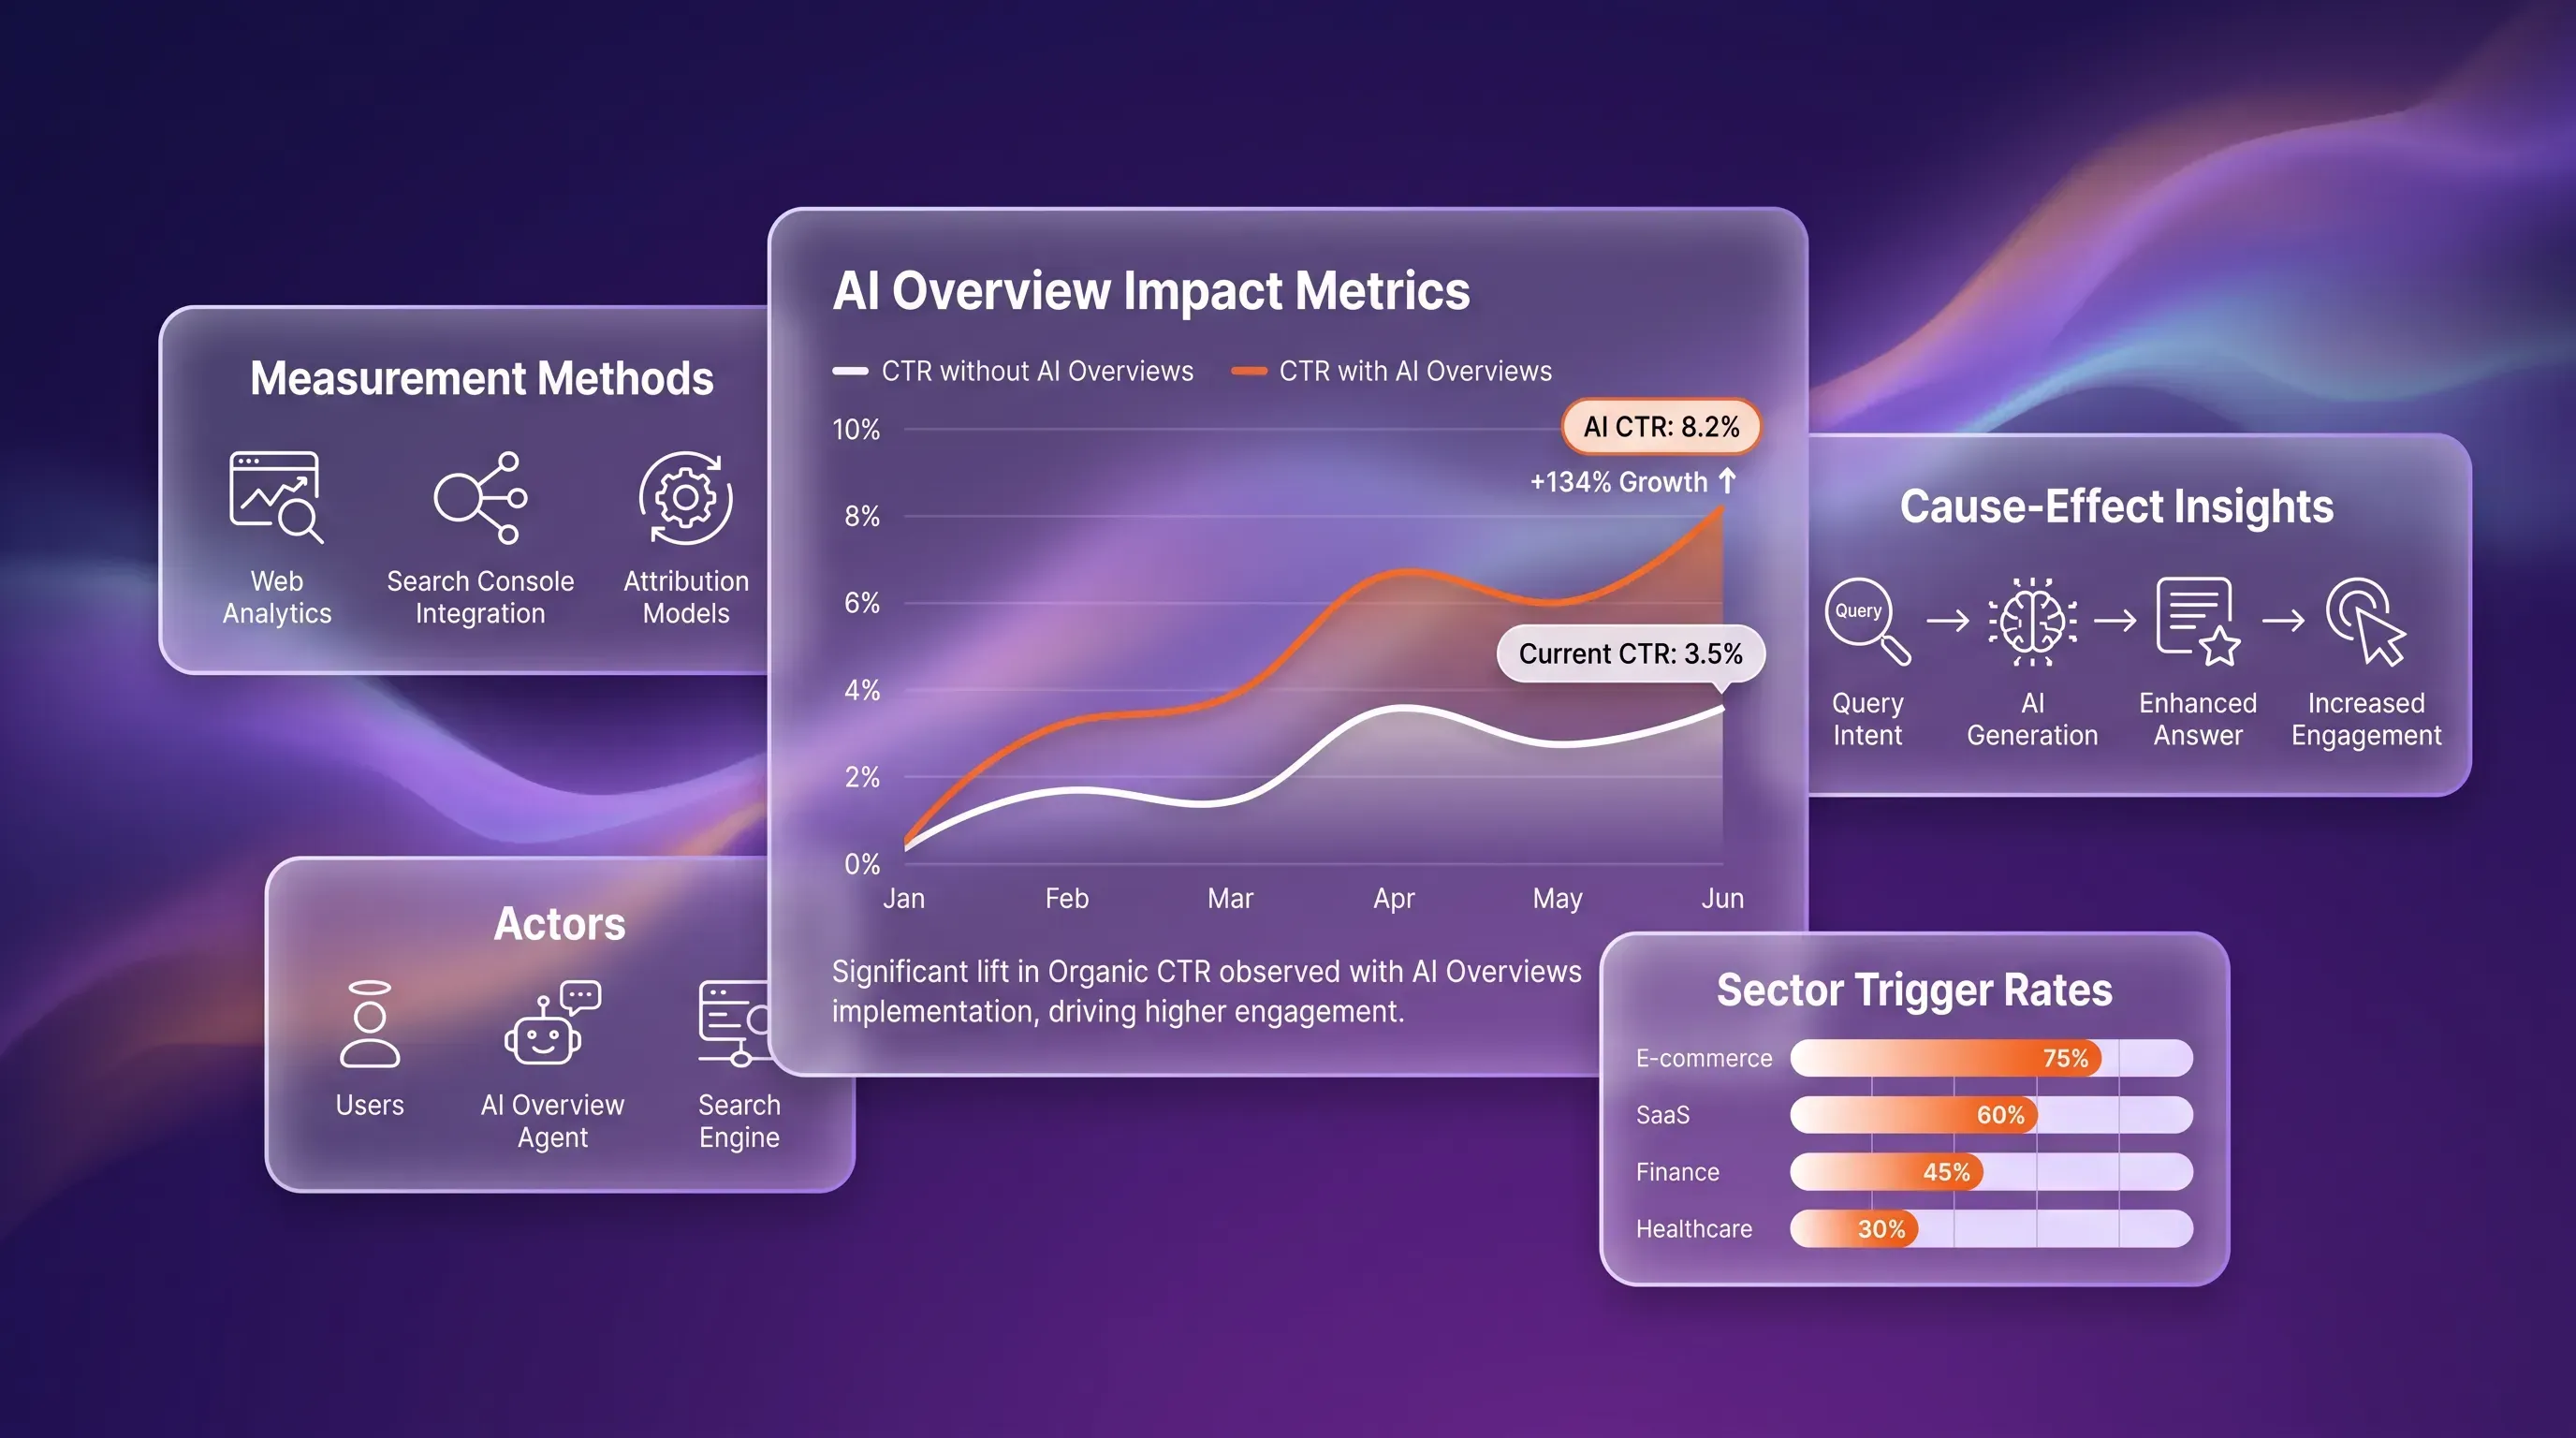
Luminous SaaS dashboard illustration with a deep purple gradient, featuring analytic cards, charts, and minimal white outline icons.

This article is a measurement playbook for anyone who already runs solid SEO reports but can't yet prove how AI Overviews are affecting their traffic. It covers the five metrics that explain AI Overview impact and turns those signals into a reporting routine your team can run on a repeatable schedule, with Google Search Console's limits handled along the way.

Why AI Overviews broke your reporting

Your rank-and-click report used to answer the question your stakeholders asked, and AI overview tracking is now the part it can't cover. An AI-generated answer sits above the results and pulls clicks away before anyone scrolls to a blue link. So a page can hold position one and still bleed traffic, and your report shows a ranking that looks fine next to a click count that doesn't.

The scale is hard to argue with. Advanced Web Ranking data showed that AI Overviews appeared on 60.32% of U.S. queries as of November 2025. When one shows up, the cost is steep. Seer Interactive analyzed 3,119 informational queries and found organic CTR fell from 1.76% to 0.61% over 15 months, while brands cited inside the overview earned 35% more organic clicks than those left out.

That's the tension this playbook resolves. Visibility now has two layers: whether an AI Overview triggers on your query, and whether you're cited inside it. Rank tracking sees neither.

What AI overview tracking actually measures

AI overview tracking measures whether an AI Overview appears on your queries and whether your domain is cited when it does; it also connects those signals to your clicks. It's a scorecard. It tells you where you stand, and nothing more.

Hold that line, because the whole article depends on it. AI overview tracking answers "where do we stand?" AI overview optimization answers "what do we do next?" Confusing the two is how teams buy the wrong tool or set a goal they can't measure against. When your measurement layer starts arguing for a tactic, it stops being a scorecard and starts being a sales deck.

The three dimensions tracking covers give the next section its frame:

  • Trigger presence: how often an AI Overview shows up on the keywords you care about

  • Citation capture: how often your domain is the source it pulls from, and which URLs earn that spot

The third dimension is the downstream traffic effect, which is the click cost of everything above. Get the vocabulary straight first, then start assembling numbers.

The five metrics that matter

No single number explains AI Overview exposure. Start with trigger rate to see your exposure, then use citation share to see whether you're capturing it. CTR impact adds the click cost when you don't. Each answers a question the others can't, which is why you track them as a set.

They also build on each other in order. There's no point measuring citation share on a keyword cluster that never triggers an overview, and CTR impact only means something once you know which queries carry an AI Overview and whether you're in it. Treat this section as the spine of your reporting. Below, each metric is broken out at the depth you can act on.

Need help with your AI visibility?

Book a free consultation with our experts we'll help you determine exactly which services your organization needs.

AI Overview trigger rate

Trigger rate is the share of your tracked keywords that surface an AI Overview. It's the foundational metric because it defines how much of your traffic is exposed to the new layout in the first place. Calculate it by running your keyword set through an ai overview tracking tool and dividing the count that returns an AI Overview by the total.

Benchmark against your own vertical, not a global average, because the spread is wide. WebFX studied 2.37 million U.S. queries and found health at 51.6% against apparel at 12%. Query length matters too, since queries of 7 words or more hit a 73.9% overview rate in that same dataset. If you work in a high-exposure sector, an accurate trigger rate is the first input any AI Overview optimization program needs. When a keyword cluster's trigger rate climbs month over month, flag it. That's an early warning that a slice of your traffic is about to move behind an AI answer.

Citation share and citation URLs

Citation share is how often your domain appears as a cited source when an AI Overview triggers. This is the visibility metric rank tracking misses completely, because you can be absent from every overview in your space and still show a healthy average position. Track it as a percentage of triggered queries where your domain is named.

Then go one level deeper and log which specific URLs earn those citations. That tells you what content Google's AI treats as authoritative, and it's the raw material any content team needs before it starts on Google AI Overview SEO. Here's the nuance worth building into your reporting: citation is not ranking. Ahrefs analyzed 863,000 SERPs and found only 38% of cited pages also rank in the top 10 for the same query, down from roughly 76% a year earlier. Because the two signals have drifted apart, you have to measure citation separately or you'll miss it.

CTR and traffic impact

Aggregate traffic hides the damage, so measure the click cost at the query or cluster level. Segment your queries into two buckets, one where an AI Overview is present and one where it isn't, then compare CTR at similar positions. Multiply the CTR delta by impression volume for those queries and you have an estimate of real clicks lost.

The position data shows how uneven the hit is. Ahrefs found AI Overviews cut position-one CTR by 58% and position-ten CTR by 19.4% as of December 2025. Cited pages recover part of that loss, while uncited pages on AI Overview queries take the full decline. Roll everything into a site-wide average and you'll see a mild dip that tells you nothing. Segment it, and you'll see exactly which clusters are hemorrhaging.

Competitor presence and share of voice

Track which competitors appear in AI Overviews for your target queries, then convert that into a share-of-voice benchmark: your citation count against the field's on the same keyword set. Set up a fixed competitor list and read the comparison over time as a continuing benchmark.

A competitor cited on a query where you're absent is a direct exposure gap, and it's one you can size. If a rival owns the citation on ten high-intent queries where you never surface, that's a measurable slice of demand being routed away from you. Reading that trend quarter over quarter tells you whether the gap is widening or closing, which is the input that later feeds any AI Overview optimization decision.

Need help with your AI visibility?

Book a free consultation with our experts we'll help you determine exactly which services your organization needs.

Where Search Console falls short

You'll reach for Google Search Console (GSC) first, and you should, because it's free and it's Google's own data. GSC now reports AI Overview impressions in a dedicated segment, so it's a real baseline. But the caveats are specific, and they matter.

Google confirmed that for an AI Overview impression to count, the link must be scrolled or expanded into view, and the entire AI Overview block occupies a single position with every source sharing it. Query-level click data inside the segment is incomplete, and the segments only hold data from the date they launched, so you can't rebuild history. Impressions can also double-count, since a page ranking on page one and cited in the overview for the same query receives two impressions while clicks don't rise to match.

That makes GSC necessary but not enough. It confirms impressions are happening. To measure citation share against competitors and isolate the click cost cleanly, you need an ai overview tracking setup with a dedicated tracking layer on top of it.

Building your tracking workflow

Five metrics only help if you collect them on a rhythm. Make them a routine your team runs on a clear cadence, with data sources tied directly to the report itself. A tiered schedule keeps measurement repeatable instead of something you scramble to assemble the day before a review:

  1. Weekly: check trigger rate and citation changes on your priority clusters, and flag anything moving fast

  2. Monthly: review traffic impact by segment and the distribution of your citation URLs

  3. Quarterly: run the strategic review and compare share of voice against your competitor set over the full period

A workflow built from GSC exports and a rank tracker works until the keyword set grows; add manual spot-checks and the seams show. A dedicated tool consolidates the signals in one place. Snoika, for example, tracks mentions and citations against a competitor set across AI search surfaces, with share of voice in the same view instead of four disconnected checks. It's one component of the workflow you're assembling. Keep the routine focused on measurement here and leave the fixes for the next stage.

Where tracking ends and Google AI Overview SEO begins

Once your ai overview tracking is solid, you have a scorecard and a decision about what to hand off. The numbers are inputs. Acting on them is a separate job, and that job is AI Overview optimization and the wider practice of Google AI Overview SEO.

That work covers the things this article deliberately skips: E-E-A-T signals and content structured so an AI can extract a clean answer; freshness belongs in that same optimization work. WebFX's healthcare study noted that Google's AI favors independent, authoritative sources over brand-biased pages, and that finding belongs in an optimization brief. Keep the boundary clean and your reporting stays honest. The moment your scorecard is built to justify a tactic, it stops measuring and starts advocating. Hand the numbers to your content or technical team as evidence, and let Google AI Overview SEO take it from there.

Start measuring before you optimize

You can't improve AI Overview visibility you can't yet see, so ai overview tracking and the measurement foundation come first. The five metrics are your scorecard, and the tiered weekly-to-quarterly rhythm is the habit that keeps it current. Build the baseline now, while AI Overview coverage is still expanding across verticals, because the sooner you start, the more trend you'll have to read. Putting a dedicated setup like Snoika in place is the sensible next step toward reliable AI overview tracking your whole team can trust.

Need help with your AI visibility?

Book a free consultation with our experts we'll help you determine exactly which services your organization needs.

Start with queries that already bring impressions or revenue-related visits. AI overview tracking works best when the keyword set includes informational searches, long questions, and high-intent terms from Google Search Console. Keep the list stable, then group keywords by topic so CTR changes are easier to explain.

Yes, if your tracking setup can collect localized search results. AI Overviews can differ by country, language, and device because Google adjusts results to the search context. Create separate views for priority markets, such as U.S. mobile and U.K. desktop, instead of mixing them into one report.

Yes, save screenshots when you report citation gains, losses, or competitor changes. AI Overview layouts and cited sources can change between crawls, so screenshots give your team a dated record of what appeared. Record the query, date, location, device, and cited URLs with each example.

Review the keyword set quarterly, but don't rewrite it every month. A stable list gives you a cleaner trend line for trigger rate, citation share, and CTR impact. Add new keywords in a separate group first, then fold them into the core set after one reporting cycle.

Use Snoika when manual checks take too much time or your team needs repeatable competitor comparisons. Manual reviews work for a small keyword sample, but they become hard to audit as markets and clusters grow. A tool-based setup keeps citations, mentions, and share of voice in one report.

Schedule a Meeting

Book a time that works best for you

You Might Also Like

Discover more insights and articles

Luminous SaaS dashboard with a deep purple gradient, featuring an 'AI Brand Tracking in LLMs' card and overlapping metric cards.

AI brand tracking for measuring brand visibility in LLMs

This article explains what AI brand tracking is and how to run it as a repeatable process. You'll learn what to measure and how to build a prompt set and metric framework you can report on; the same data also feeds the optimization work that improves your standing inside AI answers.

A vibrant abstract illustration showing 7 distinct AI implementation methods in software development, centered around a glowing AI hub.

7 Ways AI has changed software development in 2026

In 2026 software development is no longer a writing code. Now it is an AI-supported process. AI helps at every stage from planning the architecture to watching the app in production. Big industry surveys prove this. According to the Stack Overflow Developer Survey 2025, 84% of developers already use AI tools or plan to use them (up from 76% the year before). Also, 51% of professional developers use AI every day.

Luminous SaaS marketing illustration featuring a flowchart of six UI cards representing stages in a ChatGPT SEO workflow over a deep purple background.

ChatGPT SEO: A Practical Workflow for Better Visibility

This article walks through a six-stage ChatGPT SEO workflow you can run on every piece you publish. It shows where the model earns its place and where your own judgment stays in charge after dedicated tools confirm the data.

Comparison visual of AI search optimization tools with overlapping cards for Tool A and Tool B, featuring charts and evaluation criteria.

Choosing AI search optimization tools for your team

This article clears up the confusion between AI visibility tools and the keyword trackers you already run, then walks through the criteria that matter when you're buying for a team. By the end, you'll be able to run a fair trial and defend your pick.