Introduction
Performance marketing has long relied on traffic as a proxy for success, but the landscape is shifting. A recent report revealed that LinkedIn experienced a 60% drop in non-brand B2B traffic across awareness topics, even though it maintained stable rankings. This signal marks the end of the traffic-first era. By 2026, AI tools like ChatGPT and Perplexity will answer user questions directly without sending them to a website.
This shift forces companies to rethink how they define success. Optimizing only for clicks risks optimizing for a shrinking metrics pool. Instead, strategies need to focus on performance marketing KPIs that track revenue and visibility in a completely new environment. This article guides the transition and helps prioritize the metrics that drive business growth.
Traffic Crash and New Reality
The decline of traditional organic traffic creates a crisis for teams that rely solely on click-based reporting. This decline is not a temporary dip but a structural shift in how users consume information. A recent study highlights this stark reality and shows that 60% of US and EU searches now end without a click to an external website. Users get their answers directly on the search results page or through AI interfaces, and this renders the website visit unnecessary.
This zero-click environment forces companies to look beyond website sessions. While Google still processes 373 times more searches than ChatGPT, the integration of AI Overviews into standard search results drastically reduces the click-through rate (CTR). In fact, publishers report CTR declines approaching 90% for queries where AI Overviews appear. The platform keeps the user, and the brand loses the traffic data point. Updating reporting models requires action. Judging performance solely on traffic volume leads to incorrect conclusions about brand health. Teams that succeed in this environment focus on navigating zero click search trends and adopt broader measurement standards that capture value beyond the click.
Tier 1: Core Performance Marketing KPIs for Revenue
Financial metrics become the foundational elements of a robust reporting strategy because traffic metrics are less reliable. Leadership cares less about how many people visited the site and more about how much revenue the marketing team generated. Two specific performance marketing KPIs provide this proof: Customer Acquisition Cost (CAC) and Customer Lifetime Value (LTV). These metrics clarify the relationship between spend and return.
Benchmarks help teams assess their efficiency. Research indicates that a healthy B2B strategy maintains an LTV:CAC ratio of at least 3:1. This ensures that the revenue a customer generates significantly outweighs the cost to acquire them. In terms of raw costs, B2B SaaS companies typically see an average CAC between $200 and $300, while enterprise SaaS CAC often exceeds $1,000.
Tracking these metrics requires precision, especially when teams balance volume against quality. A common conflict arises when teams lower CAC by acquiring low-quality leads that churn quickly, which destroys LTV. Effective KPI tracking requires monitoring these indicators:
-
Customer Acquisition Cost (CAC): Total sales and marketing cost divided by the number of new customers acquired.
-
Customer Lifetime Value (LTV): The total revenue a business can expect from a single customer account.
-
Payback Period: The time it takes for a customer to generate enough revenue to cover their acquisition cost.
-
Marketing-Sourced Pipeline: The percentage of revenue directly attributed to marketing efforts.
Our guide on calculating b2b customer lifetime value offers a deeper analysis of long-term value. While financial metrics track the result, marketing teams must also measure the visibility that generates those results.
Tier 2: Generative Engine Optimization (GEO) Metrics

The drop in click-through rates requires a shift toward measuring "visibility" rather than just traffic. In the AI era, a brand can influence a user without that user ever visiting the brand's website. This is the core of Generative Engine Optimization (GEO). A progressive marketing strategy acknowledges that appearing in an AI answer is a win, even if it does not result in a session.
Marketers need new marketing metrics to quantify this presence. The data suggests that AI placements are high-value but low-traffic. Analysis shows that ranking in Position 1 in an AI Overview delivers roughly the same clicks as a standard Position 6 organic result. This discrepancy proves that users read the AI summary and move on. If reporting relies only on traffic, the brand appears to be failing, yet the visibility remains high. Teams need to track how often their brand informs the AI's answer. Our guide to generative engine optimization details this approach, and it allows companies to attribute value to these zero-click interactions. Companies can track this value through specific frequency metrics.
AI Citation Frequency
AI Citation Frequency measures the percentage of times a brand appears in AI responses for relevant queries. This metric replaces "rankings" in the new search environment. Because AI models generate answers dynamically, a brand might appear in one user's answer but not another's. Tracking frequency over time reveals the consistency of the brand's presence in the underlying data model.
Success in this area looks different from traditional SEO. A distinct benchmark for this metric aims for a 30% or higher appearance rate in AI responses for priority topics. This level of KPI tracking ensures that the brand remains a primary source of information for the Large Language Model (LLM). Our article on measuring brand frequency in ai outlines specific methods for setting this up. Once a brand establishes its own baseline frequency, it must compare that performance against the market.
Share of Voice in AI Answers
Share of Voice (SOV) in AI answers compares a brand's presence against its direct competitors. This metric often differs from traditional market share because AI models prioritize authoritative digital content over revenue size. A smaller, content-rich company can achieve dominance in AI answers over a larger competitor with poor digital documentation.
Monitoring this gap provides a competitive advantage. Current guidance recommends a share of voice in AI search that exceeds traditional market share by 10-20%. If a company holds 15% of the market but commands 35% of the AI answers, it is positioned to capture future demand before competitors realize the shift in information consumption. However, capturing demand requires more than just showing up in the results.
Sentiment and Trust Scores
The AI must also speak positively about the brand because appearing in the answer is not enough. Sentiment and Trust Scores track the qualitative nature of these mentions. AI models rely on structured, clear data to form these associations. Credibility in the eyes of an AI comes from technical clarity and authoritative sources.
The structure of a website plays a significant role here. Research indicates that pages with clean organization and schema markup earn 2.8 times more AI citations than poorly structured pages. Monitoring sentiment helps teams detect if the AI associates their brand with negative attributes or incorrect information, and they can correct the record through technical optimization and content updates. These updates ensure the machines understand the content, but the brand still needs to earn their trust.
Tier 3: Authority and Influence Signals
Brand authority convinces machines to trust content even after technical optimization helps them understand it. In an AI-driven environment, authority acts as the most durable asset a marketing team can build. Algorithms prioritize sources that demonstrate expertise and reliability, and they often bypass generic content farms in favor of recognized industry leaders. This shift explains why platforms like Reddit, Quora, and LinkedIn frequently appear in AI-generated answers; they represent externally validated authority where real users confirm the value of the information.
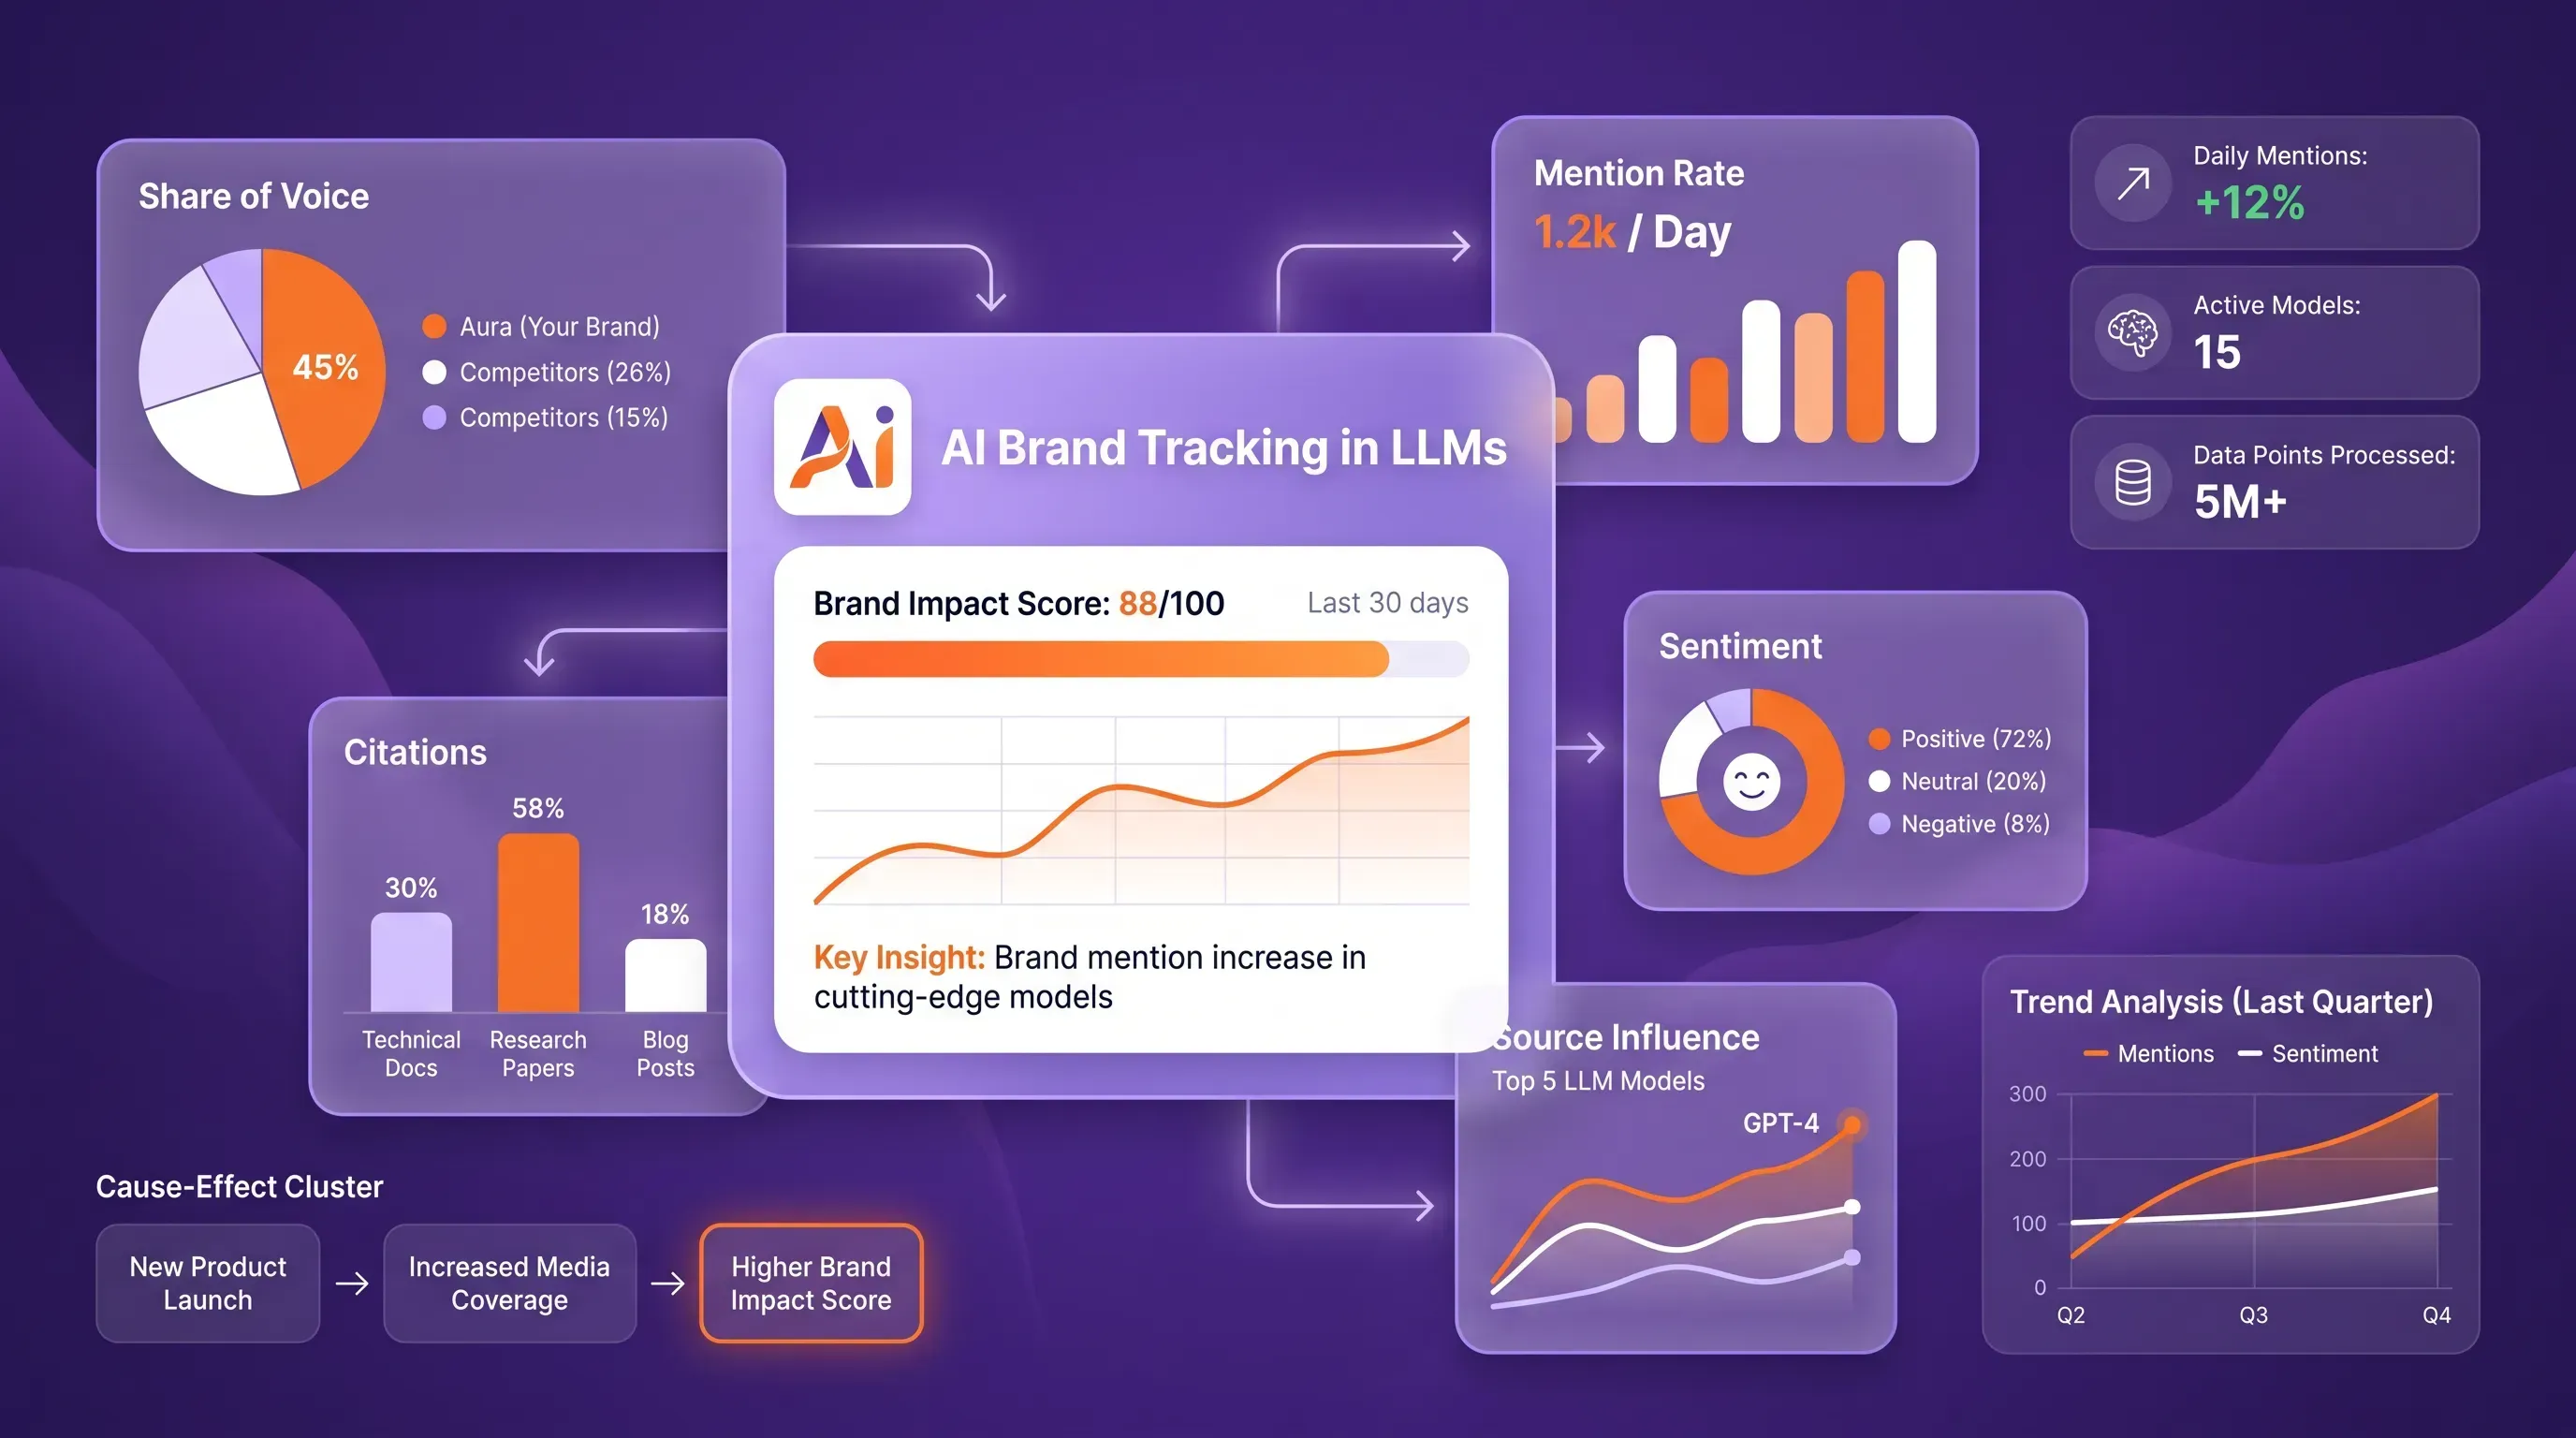
Marketing leaders must adapt their marketing metrics to capture this intangible but critical quality. Traditional keyword rankings fluctuate daily, but credible expertise drives AI citations over the long term because authority is the asset that travels across different large language models. To measure this, teams should track Brand Search Volume and Entity Authority Scores. Brand Search Volume indicates how many users bypass the discovery phase to seek a company directly, which signals strong market positioning. Entity Authority Scores measure how well search engines understand the relationship between a brand and specific topics. A thorough building brand authority strategy focuses on increasing these authoritative signals to ensure that when an AI answers a relevant question, it cites the brand as the definitive source. Yet, proving the value of that citation is difficult because the buying journey has changed.
Attribution Puzzle
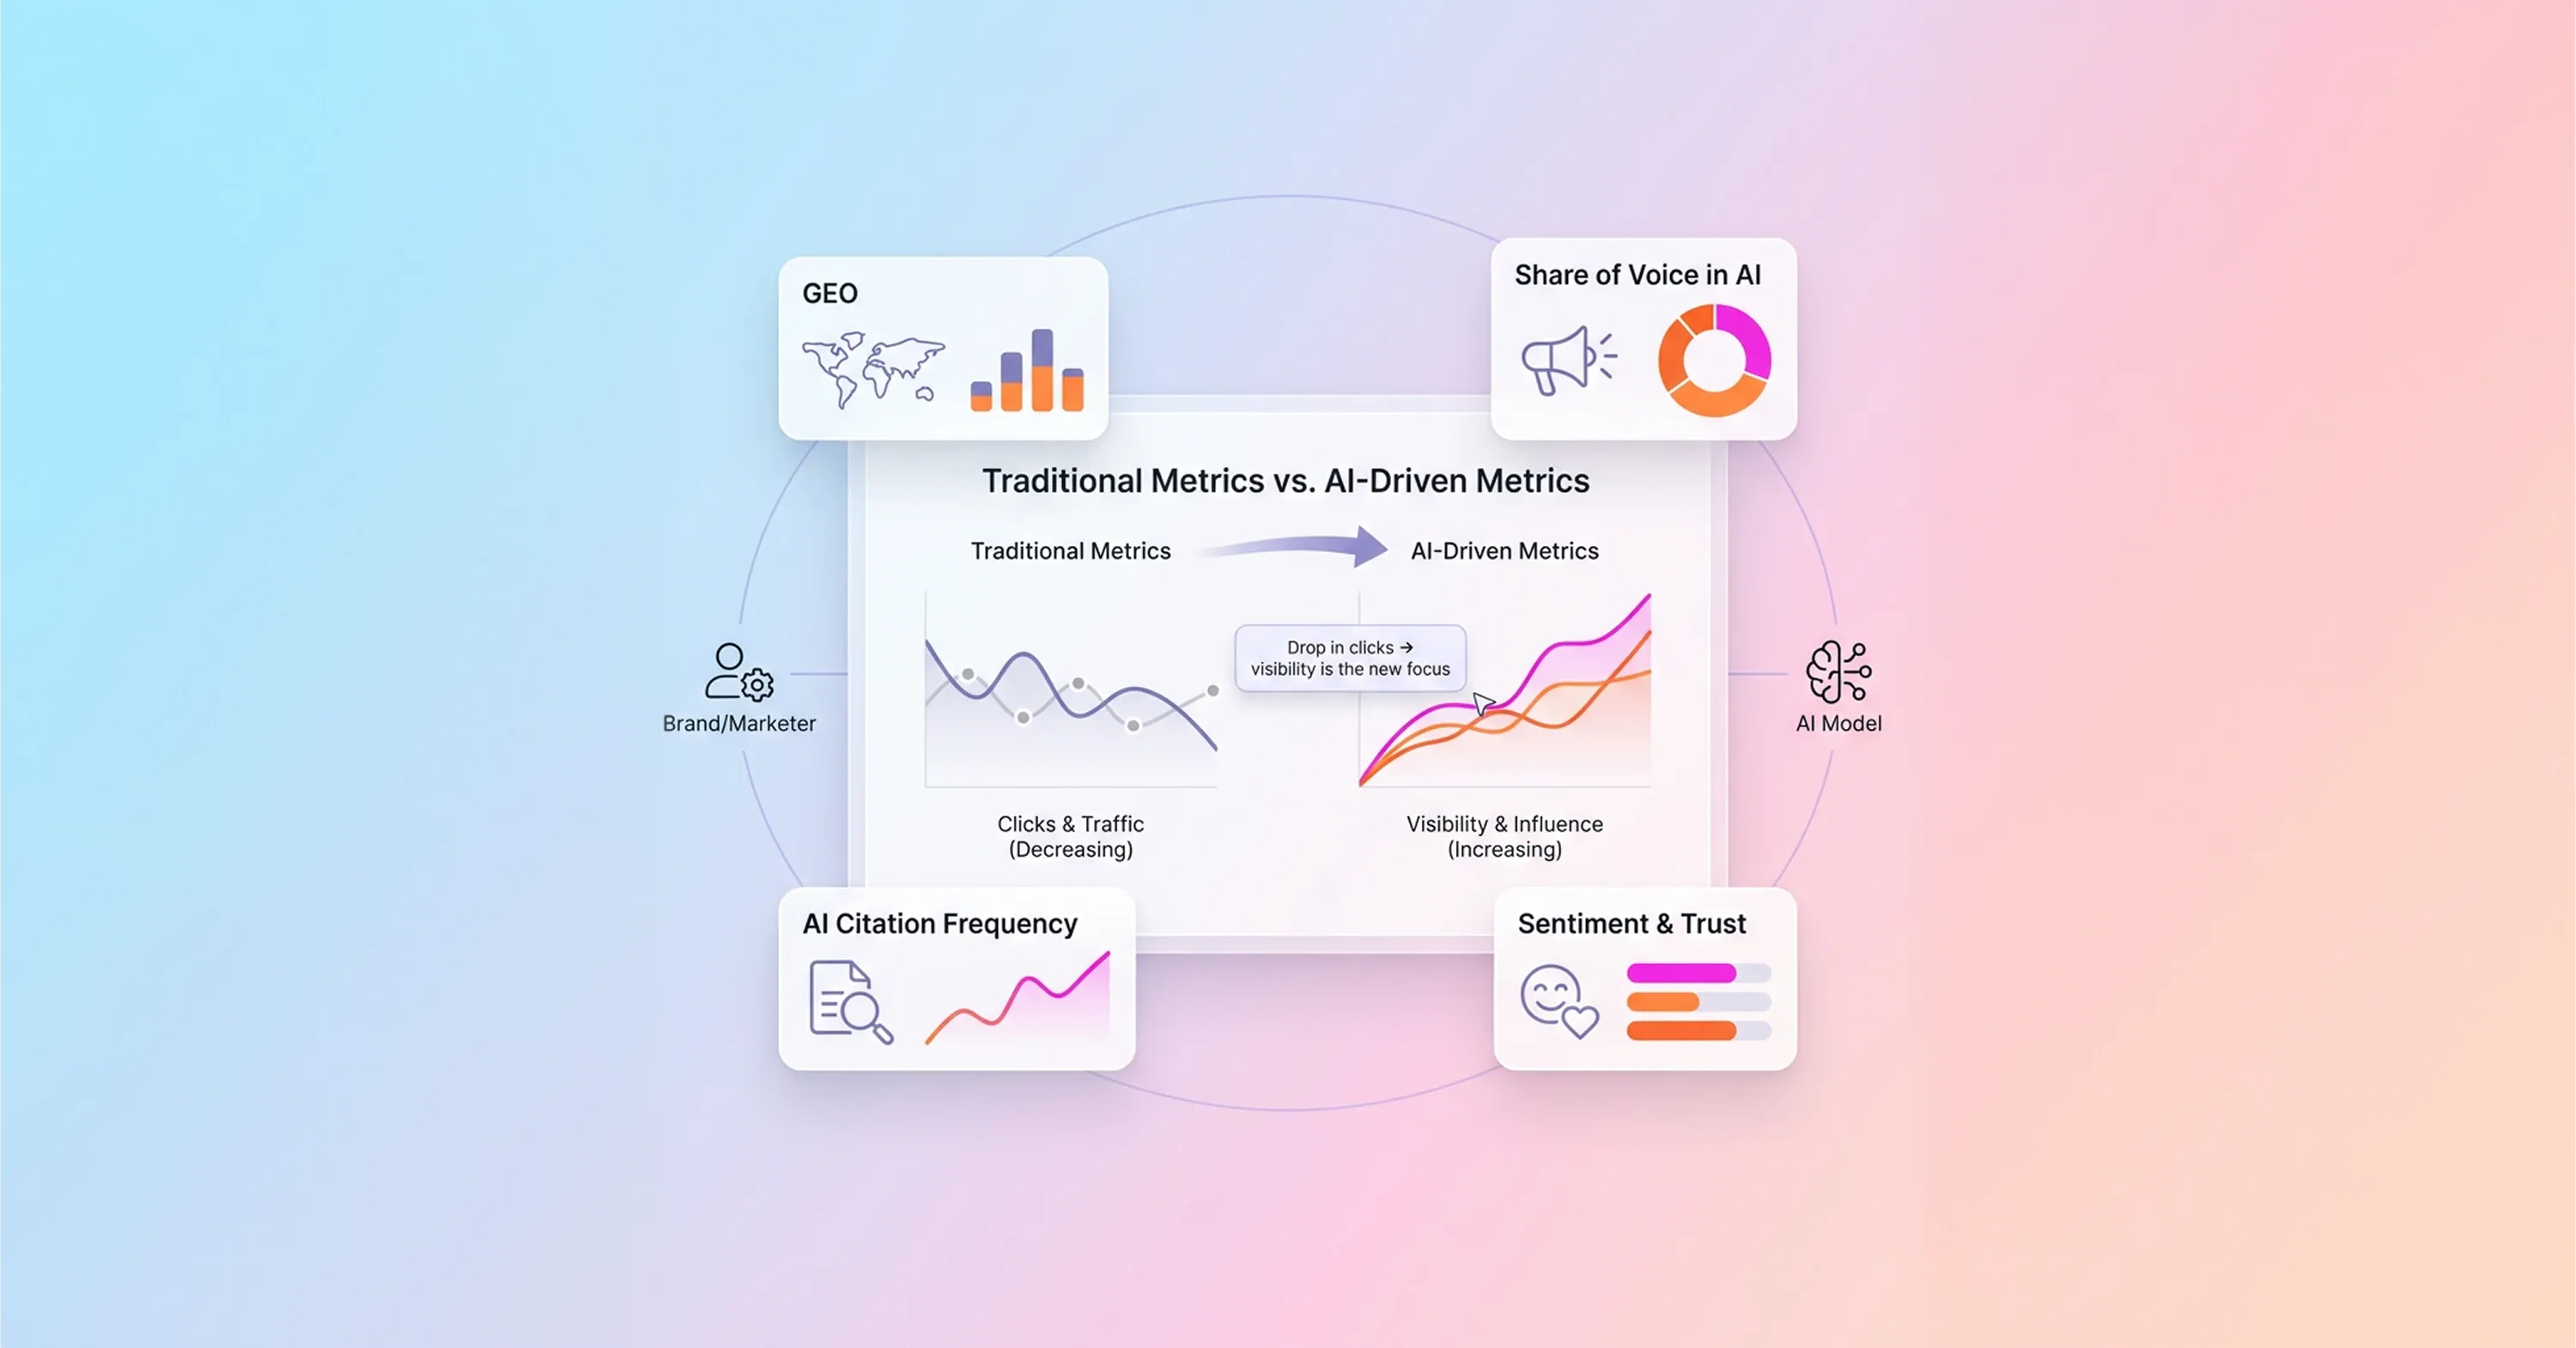
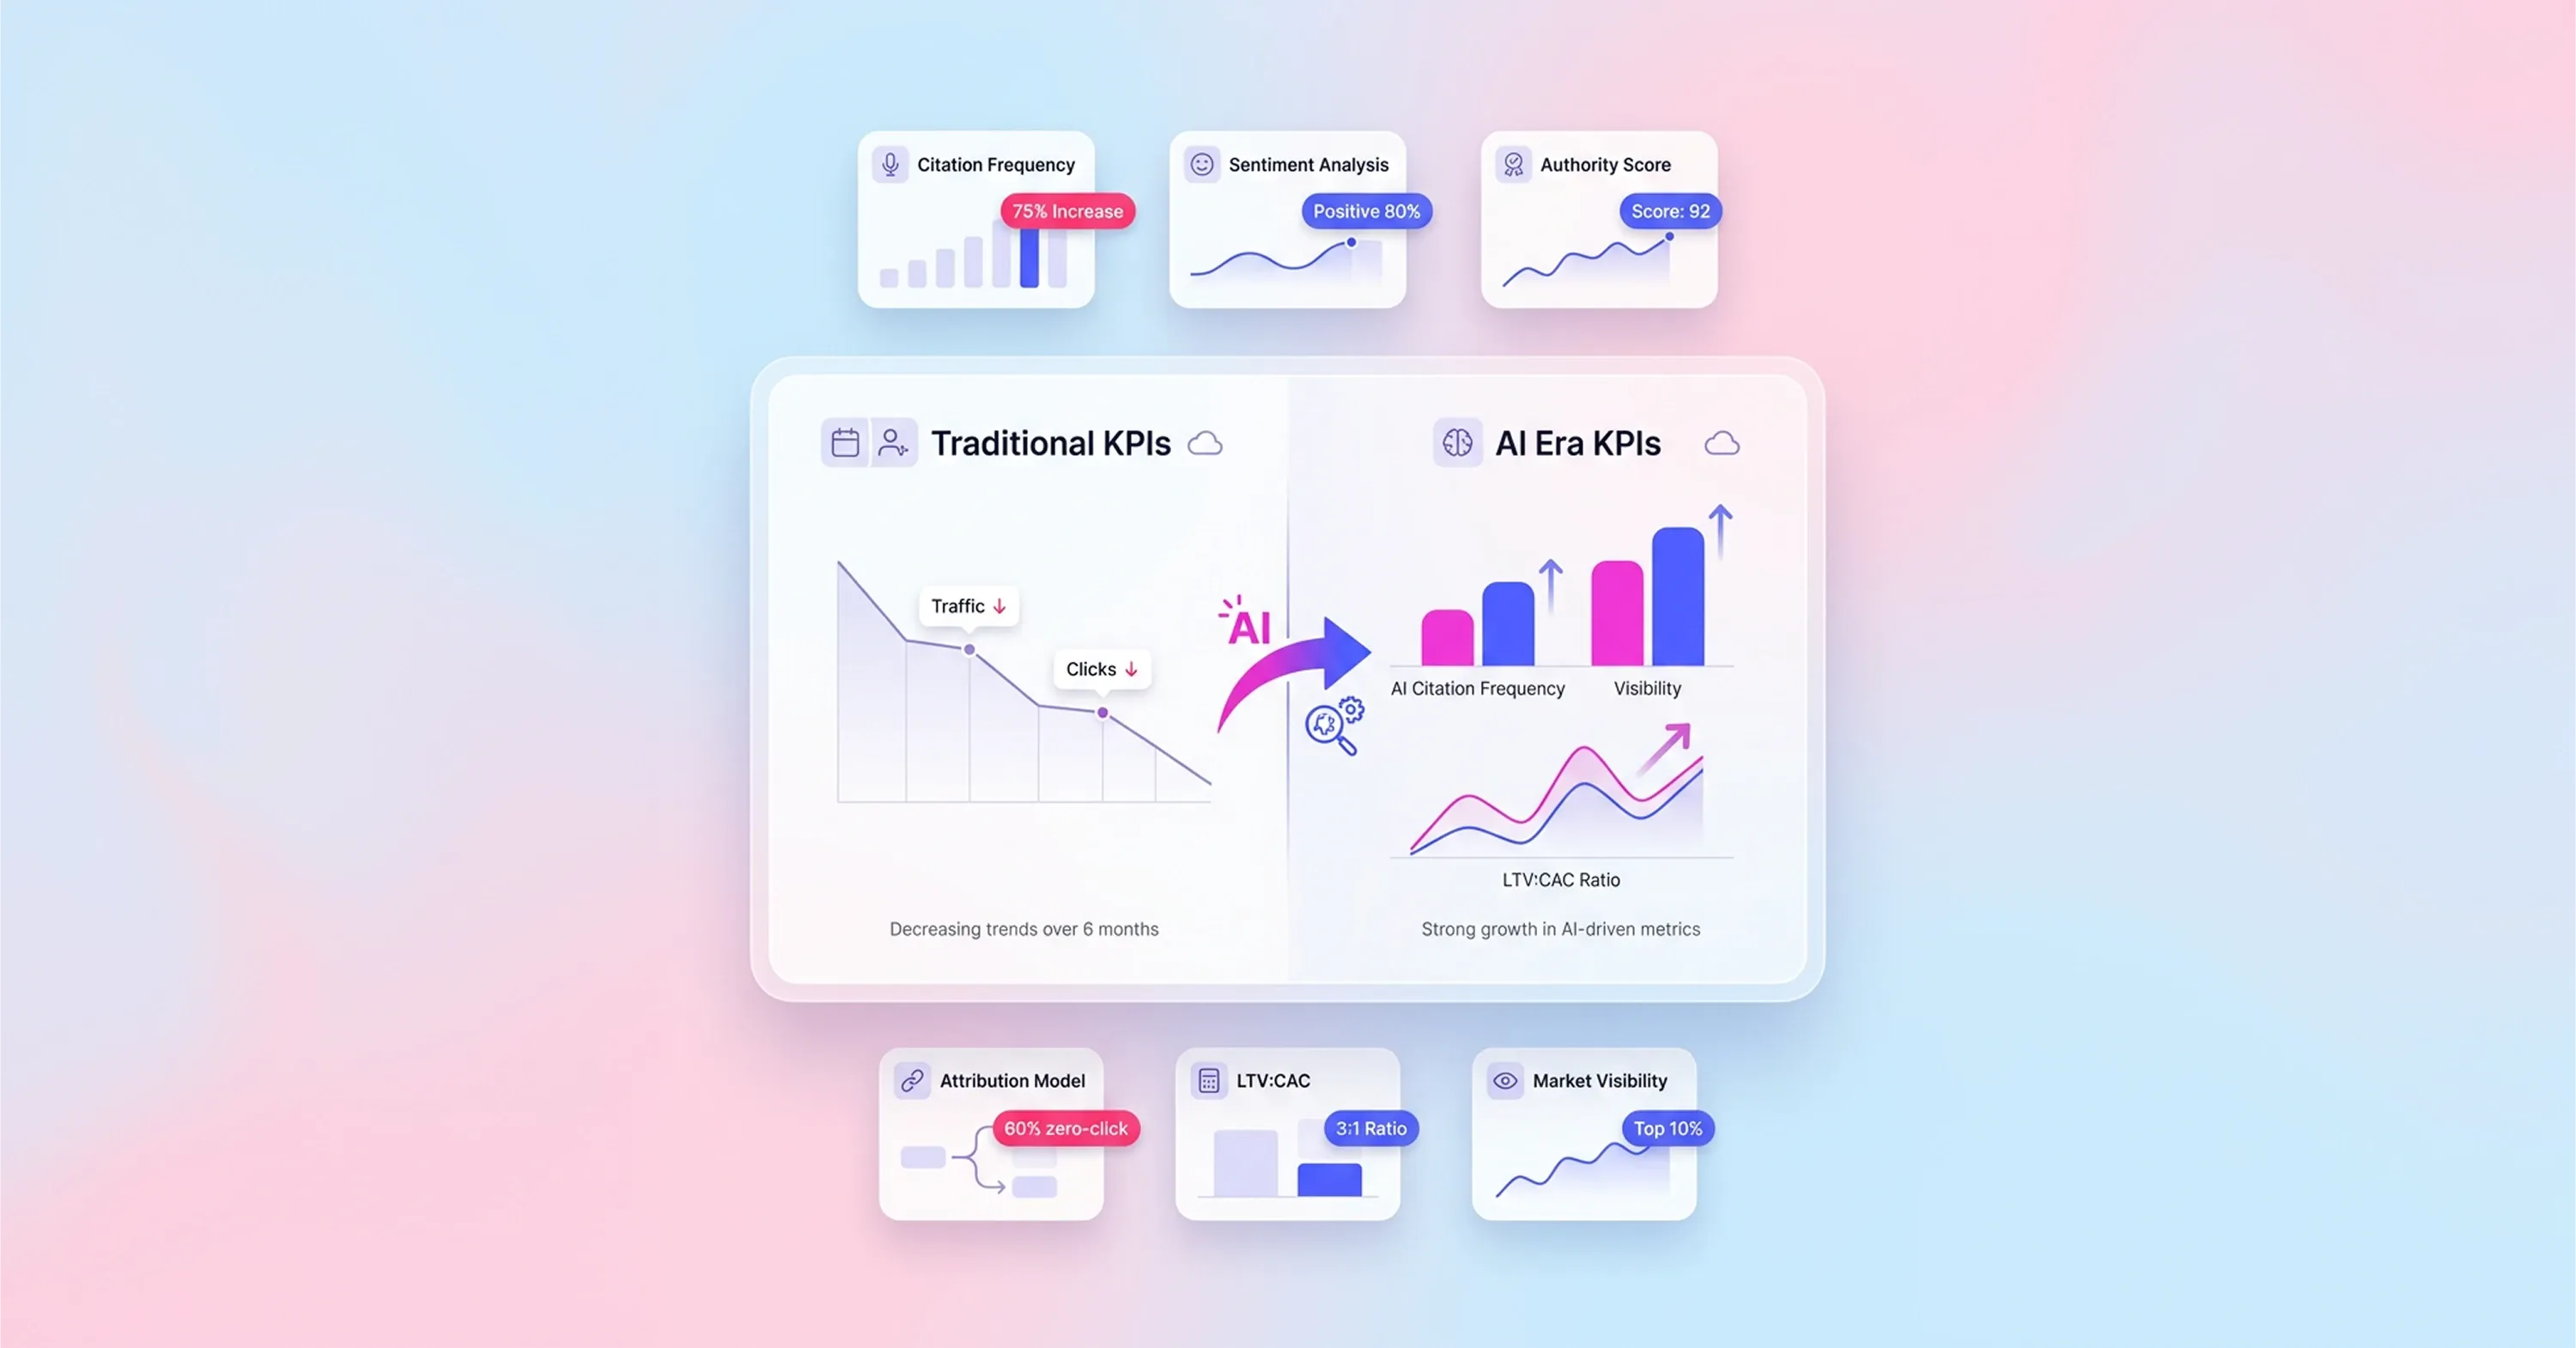
The linear path from search to click to sale rarely exists now. Most buyers gather information without ever triggering a tracking pixel, which makes last-click attribution models ineffective. An accurate view of performance requires accepting that 80% of consumers rely on zero-click results for at least 40% of their searches. Users consume the answer directly on the search results page or within an AI interface, and then they make a purchase decision later through a direct visit. Reliance solely on click-based data often leads to pausing high-performing campaigns that generate awareness but few immediate site visits.
This measurement gap widens in the B2B sector. Research shows that 69% of conversations among buyers occur in the "dark funnel" before they ever contact a vendor. These internal discussions happen offline, in private Slack communities, or over email, and they leave no digital trace for marketing software to record. To solve this, KPI tracking must evolve to include assisted conversions and revenue lift analysis. Instead of asking "which ad caused the click," marketers should measure how brand exposure correlates with overall revenue lift in specific regions or verticals. A thorough approach triangulates data from self-reported attribution ("How did you hear about us?") and correlation studies to reveal the true impact of zero-click influence. This abundance of data requires teams to make difficult choices about what to track.
Prioritization Framework
Teams lose clarity when they monitor every metric simultaneously. Marketing leaders must select a strategic set of indicators that match their company's growth stage and resource availability. Startups and mature enterprises operate with different constraints, so their performance marketing KPIs should reflect those realities. For example, data shows that 90% of companies in the B2B tech sector with $100M in revenue operate with marketing budgets exceeding $1 million, which allows them to invest heavily in broad brand authority. Smaller companies rarely have this luxury and must choose their battles carefully.
The prioritization framework suggests that (a) early-stage startups focus on efficiency metrics like CAC and payback period to ensure survival, (b) growth-stage companies balance efficiency with volume metrics like marketing-sourced pipeline, and (c) mature enterprises prioritize market dominance metrics like AI share of voice and brand sentiment. Leaders prevent data overload by categorizing marketing metrics into "Vital Few" and "Useful Many." This approach ensures that the team directs its energy toward the specific KPI tracking activities that improve results for their specific business phase, and it prevents them from chasing generic benchmarks that do not apply to their situation. A focused approach to metrics ultimately clarifies the path forward.
Conclusion
Financial metrics like ROI and CAC remain the bedrock of a strategy, but they are no longer enough. The leading indicators of future success are now authority and AI visibility. As search evolves, authority is the asset that travels. Success depends on performance marketing KPIs that capture this influence. Auditing dashboards and swapping out at least two vanity traffic metrics for revenue or citation metrics immediately strengthens the reporting process. Our guide on building a modern marketing dashboard helps structure these reports effectively.