LLM visibility as an AI search analytics workflow

Content authorArtem Lozinsky, EMBA, MScPublished onReading time11 min read
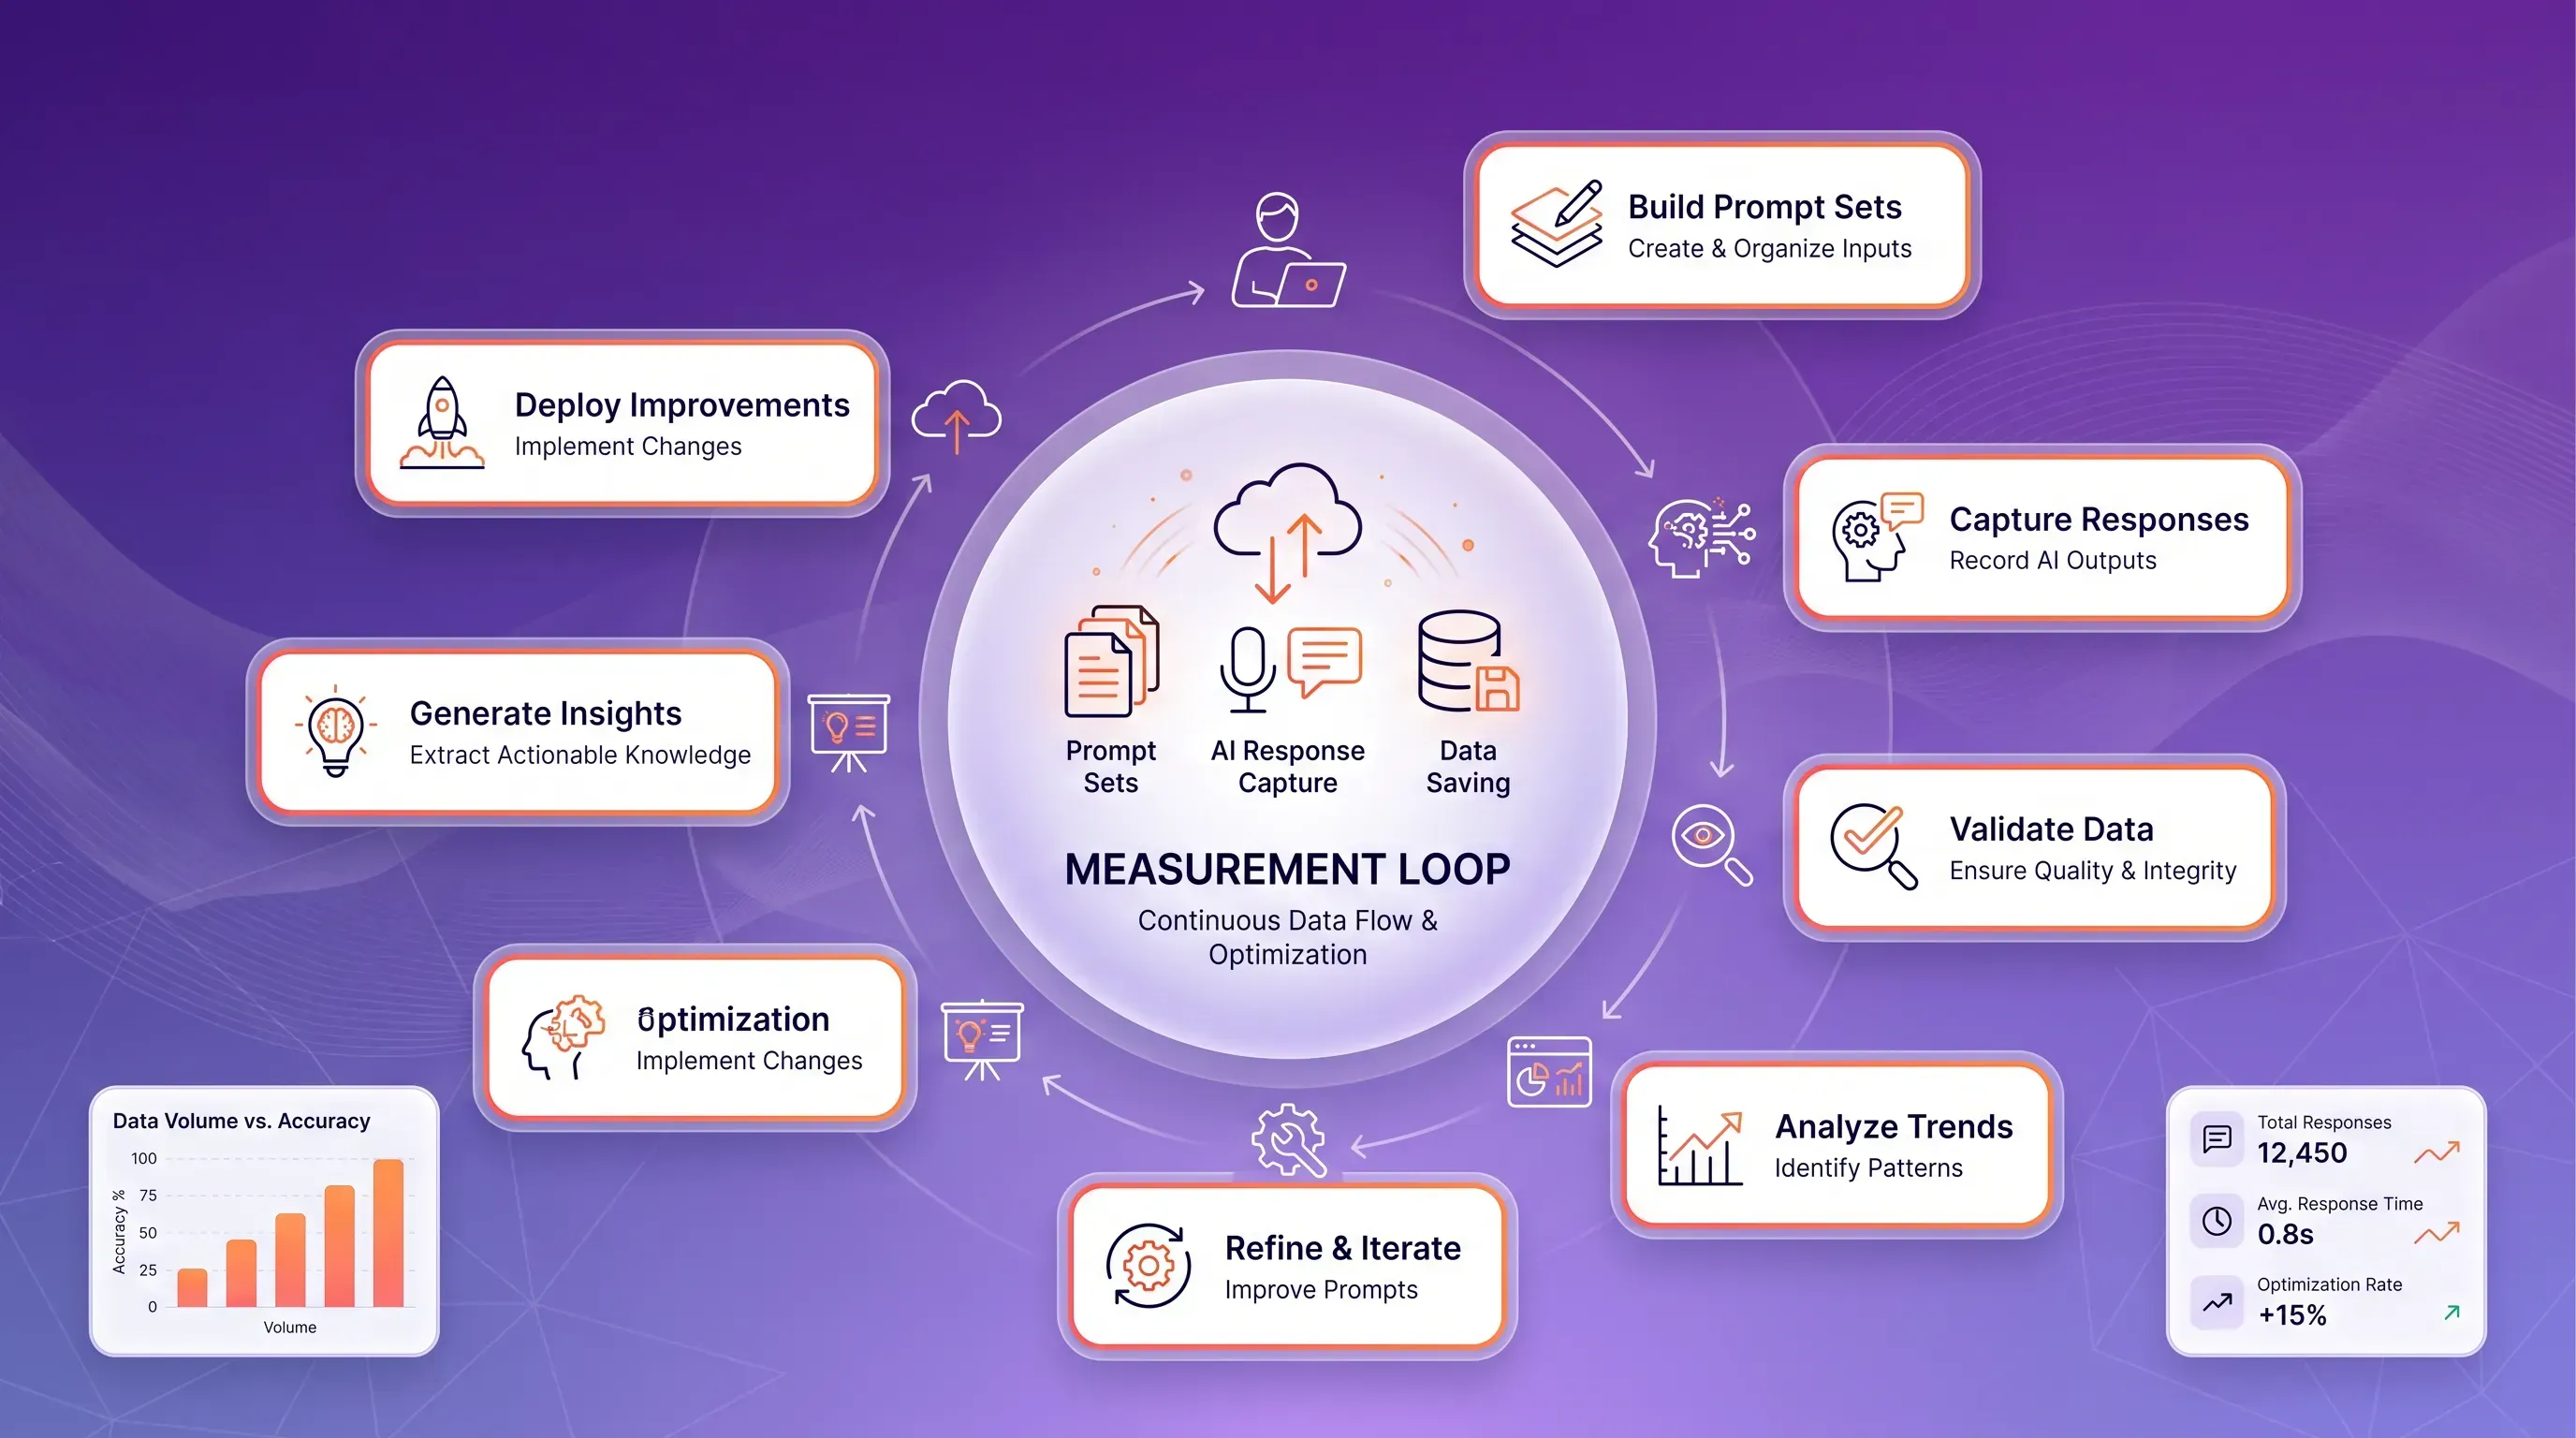
Luminous SaaS workflow flowchart with a deep purple gradient, featuring a central 'Measurement Loop' card and surrounding UI cards.

This article turns a one-time LLM visibility check into a repeatable measurement loop you can run on a schedule and defend to leadership. It walks through the full workflow, from building prompt sets to reading competitor share of voice, and it draws a clear line between what the data proves and what it cannot.

Why a one-time score falls short

You ran an LLM visibility check, and now you're staring at the number wondering what to do next. The score told you your brand showed up in some percentage of answers, while the trend in AI search performance and competitive movement remained unclear; the content that earned the mention stayed hidden too.

The deeper problem is that AI answers refuse to sit still. SparkToro and Gumshoe.ai ran the largest public reproducibility test on record when they sent 12 identical prompts through ChatGPT and Claude, with Google AI included across 2,961 runs. The probability of getting the same brand list twice was under 1%. Getting that list in the same order? Under 0.1%.

So your single snapshot captured one draw from a distribution that shifts on every query. It ages the moment you export it. A recurring measurement loop is the only honest way to read a signal that moves this much, because the trend survives the noise even when one answer never repeats. LLM visibility is an ongoing process.

LLM visibility as a workflow

The fix is to stop treating LLM visibility as a metric and start treating it as a workflow with stages that hand off to one another. Each stage produces something the next one needs, and the whole thing runs on a cadence set before the week your CMO asks.

Here's the full loop at a high level:

  • Define your prompt set and decide which models to cover.

  • Capture the responses on a fixed schedule and store them raw.

  • Extract mentions and citations from what came back.

  • Analyze competitor position and check sentiment and factual accuracy.

  • Report the changes, then decide what to fix before the next run.

Sequence matters here because every stage feeds the one after it. If your prompt set is sloppy, your capture is measuring the wrong questions. If your capture is inconsistent, your mention data reflects your method instead of the model. A broken step early corrupts everything downstream, so build the loop deliberately before tools catch your eye.

Steps in the measurement loop

The loop below is the practical core of this article. Each stage runs on repeat, and the value comes from comparing this period against the last. Teams that cut corners almost always do it in the same two places: they let the prompt set drift, or they blend results from different models into one average that means nothing.

Work through the stages in order the first time you set this up. After that, you're cycling through them on a schedule, and you can jump to whichever step you're refining.

Building your prompt sets

Your prompt set is the foundation, and it has to mirror how real buyers actually ask. That means covering the questions people pose before they know you and the head-to-head comparisons where you sit next to a competitor, with direct brand-name prompts kept in the set too. A discovery prompt like "best project management software for agencies" tests whether you enter the consideration set at all. A comparison prompt tests whether you win once you're in it.

The hard rule is consistency. If you reword prompts between checks, you can't tell whether a change in visibility came from the model or from your own edits. Keep the core set frozen so results stay comparable across periods, and add new prompts in a separate tranche as the market shifts, without touching the originals. Organize everything by intent and topic from the start, because when a gap shows up later, a well-labeled prompt set points straight at the content that needs work. Rankscale's own methodology leans on intent clusters and structured prompt modeling for exactly this reason.

This discipline is also what makes LLM visibility in AI search analytics trustworthy over time. A stable prompt library is the difference between a measurement and a guess.

Need help with your AI visibility?

Book a free consultation with our experts we'll help you determine exactly which services your organization needs.

Choosing model coverage

Coverage follows your buyers. ChatGPT is the obvious anchor, with OpenAI reporting 900 million weekly active users by February 2026. But the surfaces that matter depend on where your audience actually researches. Google AI Overviews reached 1.5 billion monthly users across 200 countries, and Perplexity processed 780 million queries in May 2025; Claude sits around 245 million monthly users. Microsoft Copilot matters more if you sell into enterprises living inside Microsoft 365.

There's a real tradeoff between breadth and clarity. Track everything and you drown in data you can't compare. Track too little and you miss where your buyers are. Pick the surfaces that match your market, then hold that list steady.

One warning that decides whether your AI search analytics stay meaningful: never blend models into a single average. They behave differently and they cite differently. Sistrix tracked 82,619 prompts over 17 weeks and found ChatGPT rotated 74% of its cited domains every week while Google AI Mode rotated 56%. Averaging those two hides the exact behavior you're paying to see. Report per model, always.

Capturing responses consistently

Capture is where method quietly poisons data if you let it. The first decision is API calls versus the real interface, because they don't show you the same thing. An API response strips away retrieval and personalization, along with the interface framing a human user sees, so it answers a different question than the one your buyer is actually asking. Both are valid, but you have to pick one and stay with it.

Hold everything else steady too. Run every check with the same timing and phrasing, and hold the region steady so any change you see reflects the model. When conditions move, the signal is no longer yours to read.

The part teams skip is storage. Save the raw responses every single time because trend analysis only works if you can go back and see what the model actually said three months ago. Rankscale's guidance says AI answers change constantly as models update and content gets recrawled, so LLM visibility should be tracked continuously. If your capture routine has been screenshots until now, this is the step that turns it into something you can actually chart.

Tracking citations and mentions

Once you have responses stored, read them structurally instead of just noting whether your name appears. Two checks matter first: whether the brand is mentioned and how it is described. When it shows up, the cited sources matter too. A brand named in passing carries far less weight than one the model actively recommends, and both differ again from a citation where your own page is the source feeding the answer.

That distinction between a mention and a citation is the one people conflate most. You can be mentioned without being cited, and cited without being mentioned by name. For LLM visibility, mention rate across many runs tells you how reliably you enter the answer. Cited sources tell you which content is doing the work, and that's where it gets uncomfortable for anyone who over-invested in their own site. McKinsey's AI Discovery Survey found a brand's own website accounts for only 5 to 10% of the sources AI search references. The rest comes from third-party editorial and user-generated content such as reviews.

Read the citations and you learn which external sources the model trusts in your category. That's a content map handed to you for free.

Need help with your AI visibility?

Book a free consultation with our experts we'll help you determine exactly which services your organization needs.

Reading AI search analytics for decisions

Now the captured data becomes AI search analytics you can act on. Three signals turn raw responses into decisions. Share of voice tells you how much of the category answer you own against named competitors. Sentiment tells you whether the model describes you in positive or negative terms, with neutral descriptions tracked separately. Accuracy tells you whether what the AI says about you is even true.

That third signal catches the failure people miss until it's expensive. When a model states your pricing wrong or attributes a competitor's feature to you, that misrepresentation reaches every buyer who asks. Rankscale surfaces sentiment alongside mentions and citations; competitor share appears in the same view, so share of voice sits next to framing in one place.

Turn these into a short decision list each cycle:

  1. Fix any factual misrepresentation first, since it does the most damage per impression.

  2. Close the content gap behind a prompt where you're absent but competitors appear.

  3. Respond when a competitor's share of voice climbs against yours over consecutive checks.

Read these as change over time. One check showing 30% share means little. Three checks showing a slide from 45% to 30% is a story worth acting on. AI search analytics earns its keep by exposing direction in AI search performance, which is precisely what the one-time score failed to do.

Turning checks into decisions

Here's the gap most teams hit once the loop is running: the dashboard fills with numbers and nobody knows which ones warrant a change in behavior. A recurring loop solves this by surfacing the three things actually worth acting on, and everything else is context you note and move past.

The first is narrative risk: the model describes you in a way that's wrong or damaging, and that description spreads with every answer. The second is a content gap, where a prompt your buyers ask returns competitors and skips you entirely, which points at content that doesn't exist or isn't earning citations. The third is a shift in AI search performance, where your standing moves against a competitor across consecutive checks.

Triage is simpler than it looks. Ask what a given check is telling you and who owns the fix. A factual error about your product is a content or PR problem, so it goes to whoever controls your owned pages and your earned media outreach. A missing mention on a high-intent comparison prompt is a content-strategy problem. A competitor's rising share is a signal to investigate their third-party presence, since that's where 82 to 95% of AI citations originate. Assign each finding an owner in the same meeting you review the data, or the loop produces insight nobody executes on. That single habit is what separates a workflow that changes AI search performance from a report that just circulates.

What the data can and can't prove

Here's where you protect your own credibility. You're under pressure to tie LLM visibility to revenue, and if you overclaim, the first skeptical question from finance will unravel your whole case. So be honest about the ceiling before someone else finds it.

AI search lacks the machinery that makes traditional attribution work. AI search lacks impressions and reliable click data. It also lacks a console that logs what every user saw. GA4 misclassifies most AI referral visits as direct or unassigned because platforms strip the referrer header, which means even the clicks you do get arrive without a clean source label. Worse, most of the value is zero-click. A buyer reads your name in a Claude answer; after the tab is closed, they search your brand three days later. That conversion looks like branded search or direct traffic, and no report ties it back to the AI moment that started it. Correlation with pipeline is real, but treating it as causation is how you lose the room.

So bring leadership an honest framing. What visibility trends legitimately indicate:

  • Whether your brand enters the consideration set for the questions your buyers ask.

  • Whether that presence is rising or falling against named competitors over time.

  • Whether AI describes you accurately, and which sources feed those answers.

The strongest defensible claim pairs visibility trends with proxies like branded search lift and a "how did you hear about us" field at purchase, which BrandViz recommends as directional evidence. Frame it that way and your workflow stays defensible for years. Frame it as revenue and it collapses the first quarter the numbers don't line up.

Making the loop a habit

The workflow only pays off if it outlives the first enthusiastic month. Set a cadence you'll actually keep: weekly for priority prompts, monthly for the full set, given that AI answers rotate 40 to 60% of cited domains every 30 days. Report LLM visibility changes and refresh your prompts and model coverage as the market moves. Only 16% of brands systematically track this today, so the team that starts the loop now and holds it will read AI search performance while competitors are still guessing. Rankscale runs each stage of this loop, from prompt tracking to sentiment; competitor share is included, so you can measure LLM visibility on a schedule this week and keep the thread.

Need help with your AI visibility?

Book a free consultation with our experts we'll help you determine exactly which services your organization needs.

Review priority prompts weekly and run the full prompt library monthly. Weekly checks help you catch competitor movement on high-intent queries, while monthly checks keep the workload manageable. Keep the schedule fixed so changes in LLM visibility reflect model behavior rather than your reporting rhythm.

Fix the source material first, then track whether the answer changes in later runs. Record the prompt, model, date, wrong claim, and affected client before making updates. Check owned pages, public profiles, review sites, and cited articles because the incorrect statement can come from outside your website.

Track countries separately if search behavior, language, or product availability differs by market. A shared prompt set hides regional differences because models can return different brands and sources for the same query in another location. Label each run by country, language, model, and date.

Use screenshots only as supporting records, not as the main dataset. They’re hard to search, compare, and audit across reporting periods. Store raw responses, extracted mentions, citations, sentiment labels, and timestamps in a structured table so trend analysis doesn’t depend on manual review.

A prompt belongs in the core set when it maps to a buyer question you expect to track over time. Keep discovery, comparison, and brand prompts in separate groups. If a new topic appears, add it as a new tranche instead of editing the original wording.

Schedule a Meeting

Book a time that works best for you

You Might Also Like

Discover more insights and articles

Title:
How to analyze competitors in AI search in 2026

Meta description:
Learn how AI search competitor analysis lets you map rival mentions and sources across platforms, so you can focus your next v

How to analyze competitors in AI search in 2026

This article is a step-by-step method for tracking where your competitors show up across ChatGPT and Perplexity. It explains how a prompt set becomes a per-platform competitive map through a log of each answer.

Title:
12 ai seo tools to improve rankings in 2026

Meta description:
Compare ai seo tools to find options that fit your budget and help you improve rankings or earn AI answer mentions.

Article:
# 12

12 AI SEO tools to improve rankings in 2026

This article walks through 12 AI SEO tools and names the one thing each does best, so you can tell which help with classic Google rankings and which earn you mentions inside AI answer engines. By the end, you can shortlist two or three that fit your budget and your priority.

Abstract SaaS dashboard infographic with a deep purple gradient, featuring a central floating card and minimal icons for AI tool evaluation.

Answer engine optimization tools for AI search dashboards

This article shows you how to evaluate answer engine optimization tools against the way your team actually works. It covers what makes a dashboard usable across roles and how trusted answer tracking data turns a screen reading into work.

Luminous abstract SaaS dashboard featuring a central card with a line chart and rounded bar widgets, set against a deep purple gradient.

LLM visibility tools: how to evaluate and use them

This article explains what LLM visibility tools do and which metrics deserve your attention, with context on how they generate their numbers. It gives you a methodology-first way to compare vendors and a workflow for turning a visibility gap into a move your team can own.