How to Measure Whether Google AI Overviews Improve Brand Discovery

Content authorArtem Lozinsky, EMBA, MScPublished onReading time11 min read
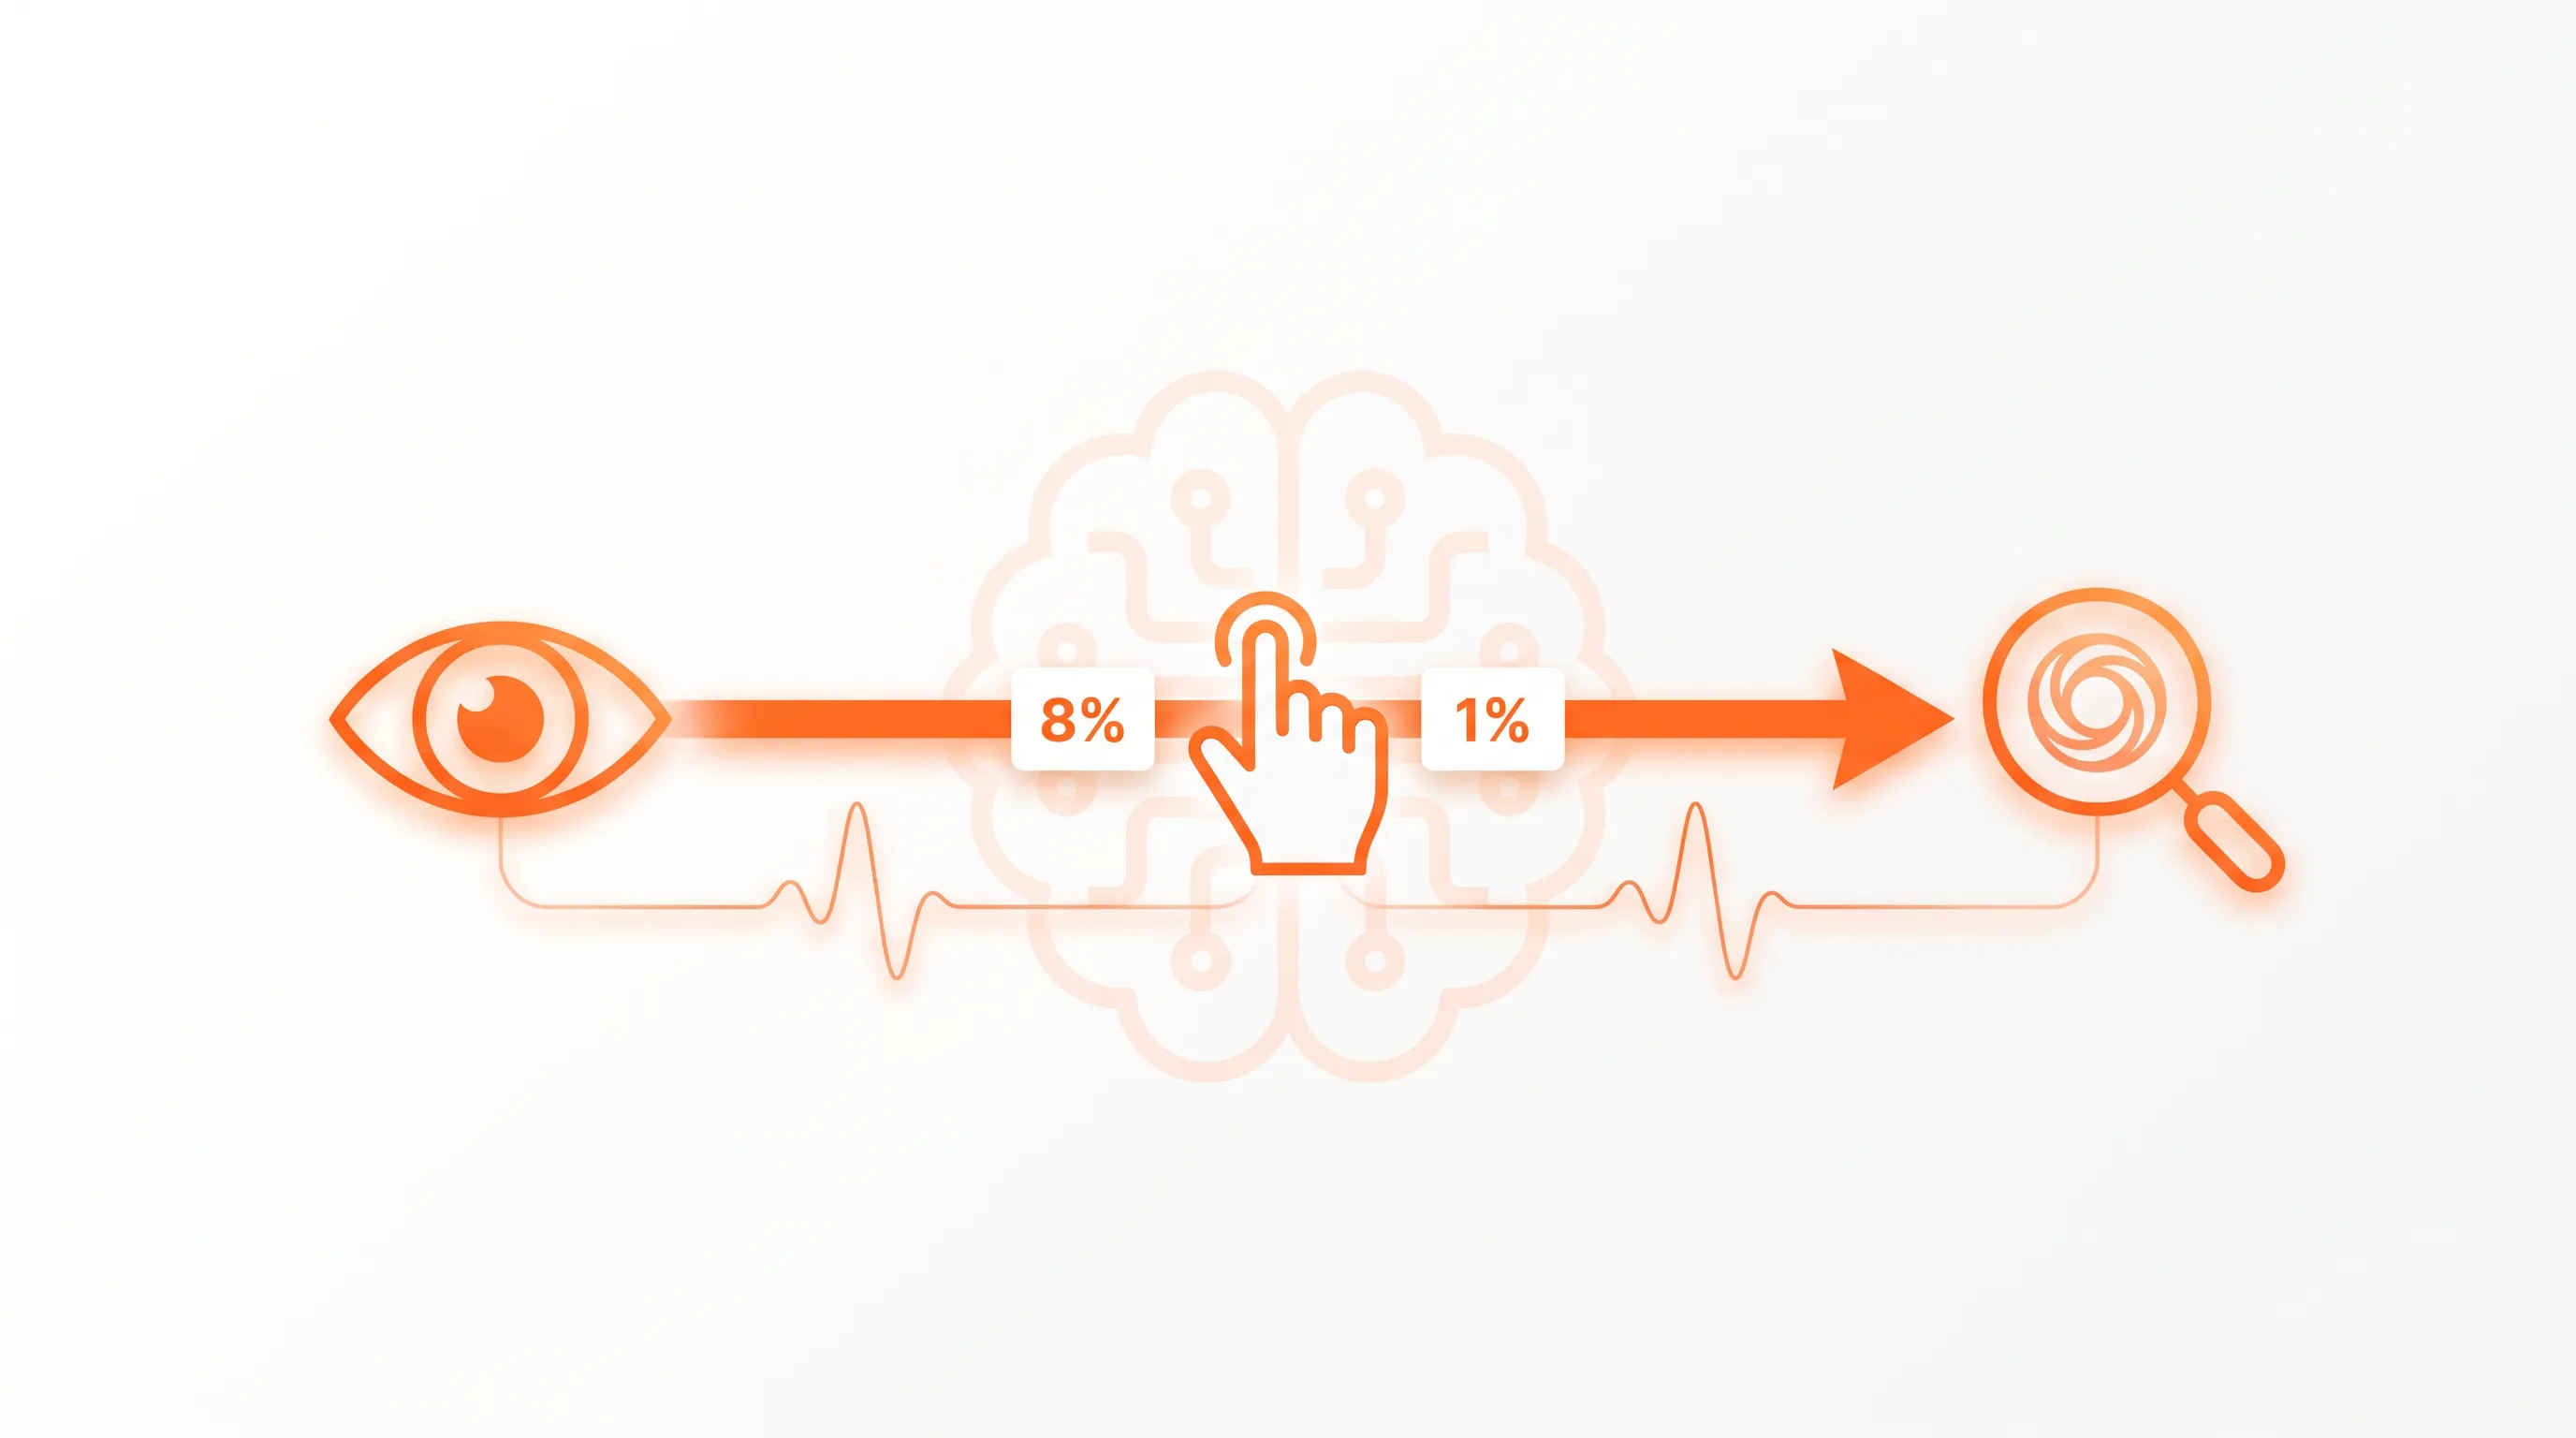
Minimalistic SaaS marketing visual featuring a bold orange flow arrow connecting icons for exposure, traffic, and brand discovery.

Measure discovery. Track how often your brand is cited and named inside AI Overviews and how your presence compares with competitors on the same queries. Then check whether branded search and revenue move in the same direction over the following weeks.

What counts as better brand discovery?

Better discovery means more of the right people see your brand correctly described on the searches that matter, whether or not anyone clicks. That's a different standard from rankings, and it has to be, because the click stopped being the only outcome of a search. A page that holds position one can lose half its traffic and still reach more people than it did a year ago.

The Pew Research Center tracked 68,879 real Google searches from 900 US adults in March 2025 and found users clicked a traditional result in 8% of visits with an AI summary versus 15% of visits without one. Links inside the summary were clicked 1% of the time.

Read that last number carefully. A citation is worthless as a traffic channel and valuable as an exposure channel, which means you should stop scoring citations against a click target they were never going to hit.

Start with a defensible baseline

Your baseline is only defensible if it holds the query set constant across the same market and device for a fixed reporting window, and if it records how common AI Overviews were during that period. That last condition is the one most teams skip, and it's the one that breaks the comparison.

Semrush tracked more than 10 million keywords through 2025 and found AI Overview coverage climbed from 6.49% of queries in January to near 16% by November. Google has since kept adjusting where the feature appears.

So a year-over-year drop in clicks on a query group tells you almost nothing unless you know whether AI Overview prevalence on those exact queries went up, down, or sideways between the two windows. Freeze the query list first and pull the same markets and devices. Then log seasonality and core update dates in the same sheet, because you'll need them when someone asks why March looked strange.

Which queries should teams track?

Weight your tracking toward non-branded and category queries, because those are the searches where someone who has never heard of you can still find you. Branded queries measure demand you already earned.

Amsive analyzed 700,000 keywords across 10 sites in five industries and found only 4.79% of branded keywords triggered an AI Overview, while non-branded terms saw click-through fall 19.98% when one appeared.

That split has a practical consequence. If your query set skews branded, your dashboard will look stable while your actual discovery surface erodes underneath it, because the searches doing the discovering are the ones you're barely watching. Group by intent instead: category queries and comparison queries along with problem-led phrasing that never mentions a vendor. Those three groups are where an unfamiliar searcher meets you or meets someone else.

What should the baseline record?

Record the exposure layer and the outcome layer separately, and mark every query with whether an AI Overview appeared on the day you sampled it. Without that flag, you can't segment anything later.

On June 3, 2026, Google launched a Generative AI features performance report in Search Console covering impressions from AI Overviews and AI Mode, broken out by page and country for each device and date. Version one reports impressions only.

Google reporting exposure but withholding clicks is itself a finding: it confirms citations and traffic have decoupled enough that the two now need separate reporting lines. So your baseline sheet needs rankings and impressions next to citation and mention counts, along with the conversion and revenue figures tied to each query group.

Need help with your AI visibility?

Book a free consultation with our experts we'll help you determine exactly which services your organization needs.

What provides a useful comparison?

Build a control group. Pair every AI Overview query with a similar query that doesn't trigger one, matched on intent and volume, so you can separate the feature's effect from the general decline in search click-through.

Ahrefs ran exactly this design in December 2025 as it compared 150,000 keywords with an AI Overview against 150,000 informational keywords without one and measured a 58% lower click-through rate for the top-ranking page on the affected set.

The control is what turns a complaint into evidence. If your AI Overview queries and your matched control queries both lost 20% of clicks, the AI Overview isn't your problem. If the control held flat while the affected set fell, you have a clean signal and a narrow place to act.

Which awareness signals reveal discovery?

Citation frequency and brand mention rate inside the answer text tell you whether Google is putting your brand in front of more people.

Seer Interactive tracked 53 brands across 5.47 million queries and 2.43 billion impressions, and found brands cited inside an AI Overview earned roughly 120% more organic clicks per impression than uncited brands on the same query.

The clicks concentrated on whoever Google named. That reframes citation frequency from a vanity count into the closest thing you have to a leading indicator, because the same query sends meaningfully different traffic depending on which side of the citation line you're on. Mention without citation still counts, though. Being named in the answer text seeds the branded search that shows up in your analytics three days later with no referrer attached.

Which outcomes show business impact?

Downstream outcomes confirm discovery, and they arrive late. Watch branded search volume and revenue attached to the affected query groups, then look for movement that follows your awareness gains.

Similarweb's analysis of AI visibility found brand search correlates with AI mentions at 0.18 to 0.39, and recommends treating a 10% to 25% branded search lift within six months as the verification signal for visibility work.

A correlation in that range is real and loose. Which means branded search lift is good enough to confirm a trend across a quarter and nowhere near precise enough to attribute a single month's revenue to an AI Overview citation. Add a "how did you hear about us" field to your demo form. Self-reported attribution captures what the tracking pixel structurally cannot, and it costs you one line of HTML.

A scorecard prevents misleading conclusions

Keep the awareness line separate from the traffic line and the revenue line and never average them into one score. Collapsing unlike metrics hides the exact pattern you're trying to detect, which is visibility rising while clicks fall.

Seer's per-impression math shows why the layers have to stay apart. Per million impressions on informational queries, queries with no AI Overview produced about 33,500 clicks, while cited brands received about 20,743 clicks against about 9,445 for uncited brands.

Cited brands lost clicks against the old baseline and more than doubled the uncited group. A single blended score reads both of those as "down" and tells you nothing about which lever to pull. Report percentage change and absolute change against baseline on each layer, then write one sentence on direction. Your scorecard covers:

  • Awareness: citation rate and mention rate

  • Traffic: clicks and branded search volume

  • Revenue: assisted conversions and pipeline tied to affected query groups

Need help with your AI visibility?

Book a free consultation with our experts we'll help you determine exactly which services your organization needs.

How should awareness be scored?

Weight awareness by query value. A citation on a comparison query where buyers are choosing is worth more than ten citations on definitional queries, and an unweighted count will tell you the opposite.

Semrush found the intent mix shifting underneath everyone: keywords triggering AI Overviews went from 89.03% informational in October 2024 to 57.16% in October 2025, with commercial and navigational queries picking up the difference.

That shift is the reason to reweight now rather than later. The feature is moving into the queries where money changes hands, so an awareness score built on informational appearances is measuring the part of the surface that matters least and shrinking fastest. Score citation rate and mention rate per query group and multiply by a commercial weight you set yourself.

How should traffic be scored?

Score traffic against the control group. And when visibility climbs while clicks fall, flag it for review instead of filing it as damage.

Position matters more than it used to. Amsive measured a 27.04% click-through decline for keywords outside the top three when an AI Overview appeared, against a 15.49% average across the full keyword set.

So a page sitting at position six on an AI Overview query is losing clicks roughly twice as fast as the average, which makes position four-to-ten content the first place to look when traffic drops and the last place worth defending with more of the same content. Track clicks and branded search side by side. Rising impressions with falling clicks and rising branded search is a discovery gain wearing a traffic loss costume.

How should revenue be scored?

Score revenue directionally and say so in the report. The honest method is to correlate movement in affected query groups with pipeline.

Similarweb recorded referrals from generative AI platforms to transactional sites growing 357% year over year as of Q4 2025, with AI referral traffic converting at roughly 7%, matching traditional search on rate while arriving in far smaller volume.

Small volume converting at parity is an early channel. Track assisted conversions and pipeline against your affected query groups, then compare those figures with an unaffected group over the same window. If the affected group holds revenue while losing sessions, your discovery improved and your reporting was the only thing that got worse.

Verification catches harmful visibility

Sample the actual answers. Automated counts tell you that you appeared, and only a human reading the text can tell you whether the appearance helped or hurt.

Accuracy is not a given. Oumi evaluated Google AI Overviews against the SimpleQA benchmark and published on April 14, 2026 that roughly 50% of overviews were untrustworthy, with hallucination rates rising between the Gemini 2 and Gemini 3 versions powering the feature.

A coin-flip accuracy rate on a surface reaching billions of queries means a rising citation count can be a rising misinformation count, and your dashboard would show both as green. Pull 20 to 30 sampled results per quarter and check each one:

  • Is the brand cited and described accurately?

  • Does the framing favor you, and do you appear at all on category-level prompts?

  • Do competitors dominate the recommendation, or do unsupported claims about your product appear?

Trends matter more than snapshots

Judge movement over weeks, never over a single check, because AI Overviews rewrite themselves faster than any Google surface you've tracked before. One bad Tuesday is noise.

Authoritas measured this across 11,203 keywords on Google.com and scored AI Overview ranking volatility at 0.68 against 0.49 for organic rankings, which showed that around 70% of the pages appearing in AI Overviews change over two to three months.

At that rate of churn, monthly rank-tracking habits sample far below the speed of change, and a team reacting to one week's disappearance will rewrite a page that was going to come back on its own. Check priority queries weekly under identical conditions, then judge sustained direction across four to six observations. Read that movement next to your broader organic performance and conversion trend before anyone rewrites the content strategy. Use AI visibility as a complementary signal rather than relying on rankings alone.

Monitor discovery systematically with Snoika

The measurement approach in this article needs a monitoring layer that runs without you, because checking citations by hand at the cadence volatility demands is not sustainable past a few dozen queries. Snoika is an AI visibility platform, founded by Anton Vedeshin and registered in Estonia, that tracks brand mentions and competitor visibility across ChatGPT and Google AI Overviews.

The platform simulates real user prompts on a weekly schedule and reports how often and how favorably your brand appears, which covers the awareness layer of the scorecard. You keep Search Console for impressions and analytics for sessions and engagement, plus your CRM for pipeline. Snoika fills the column those three cannot produce.

Start with the free AI visibility check. Run your 20 highest-value non-branded queries through it and compare them against the same 20 in 30 days.

Need help with your AI visibility?

Book a free consultation with our experts we'll help you determine exactly which services your organization needs.

A citation links to a source associated with your brand, while a mention names your brand in the answer text without necessarily linking to it. Track both measures separately because a mention can create awareness even when Google provides no direct path to your site.

Use the same country, language, device, browser settings, and query format for every check. Clear stored search data or use a controlled testing environment, then record the date and conditions. These steps limit variation that could otherwise look like a change in visibility.

Branded search growth supports the claim when it follows sustained citation or mention gains and exceeds the movement in a comparable control group. Treat the result as supporting evidence, not proof of causation, because advertising, news, seasonality, and other campaigns can also change branded demand.

Record the exact wording, query, date, device, and cited sources before changing anything. Check whether your own pages state the correct information clearly, then update outdated content and submit corrections through Google's available feedback options. Keep inaccurate appearances in a separate risk log.

You can compare countries only after measuring each one with its own query set, language, device mix, and reporting period. Report results separately before combining them, because Google can show different summaries and sources by location. A global average can hide a serious visibility gap in one market.

Schedule a Meeting

Book a time that works best for you

You Might Also Like

Discover more insights and articles

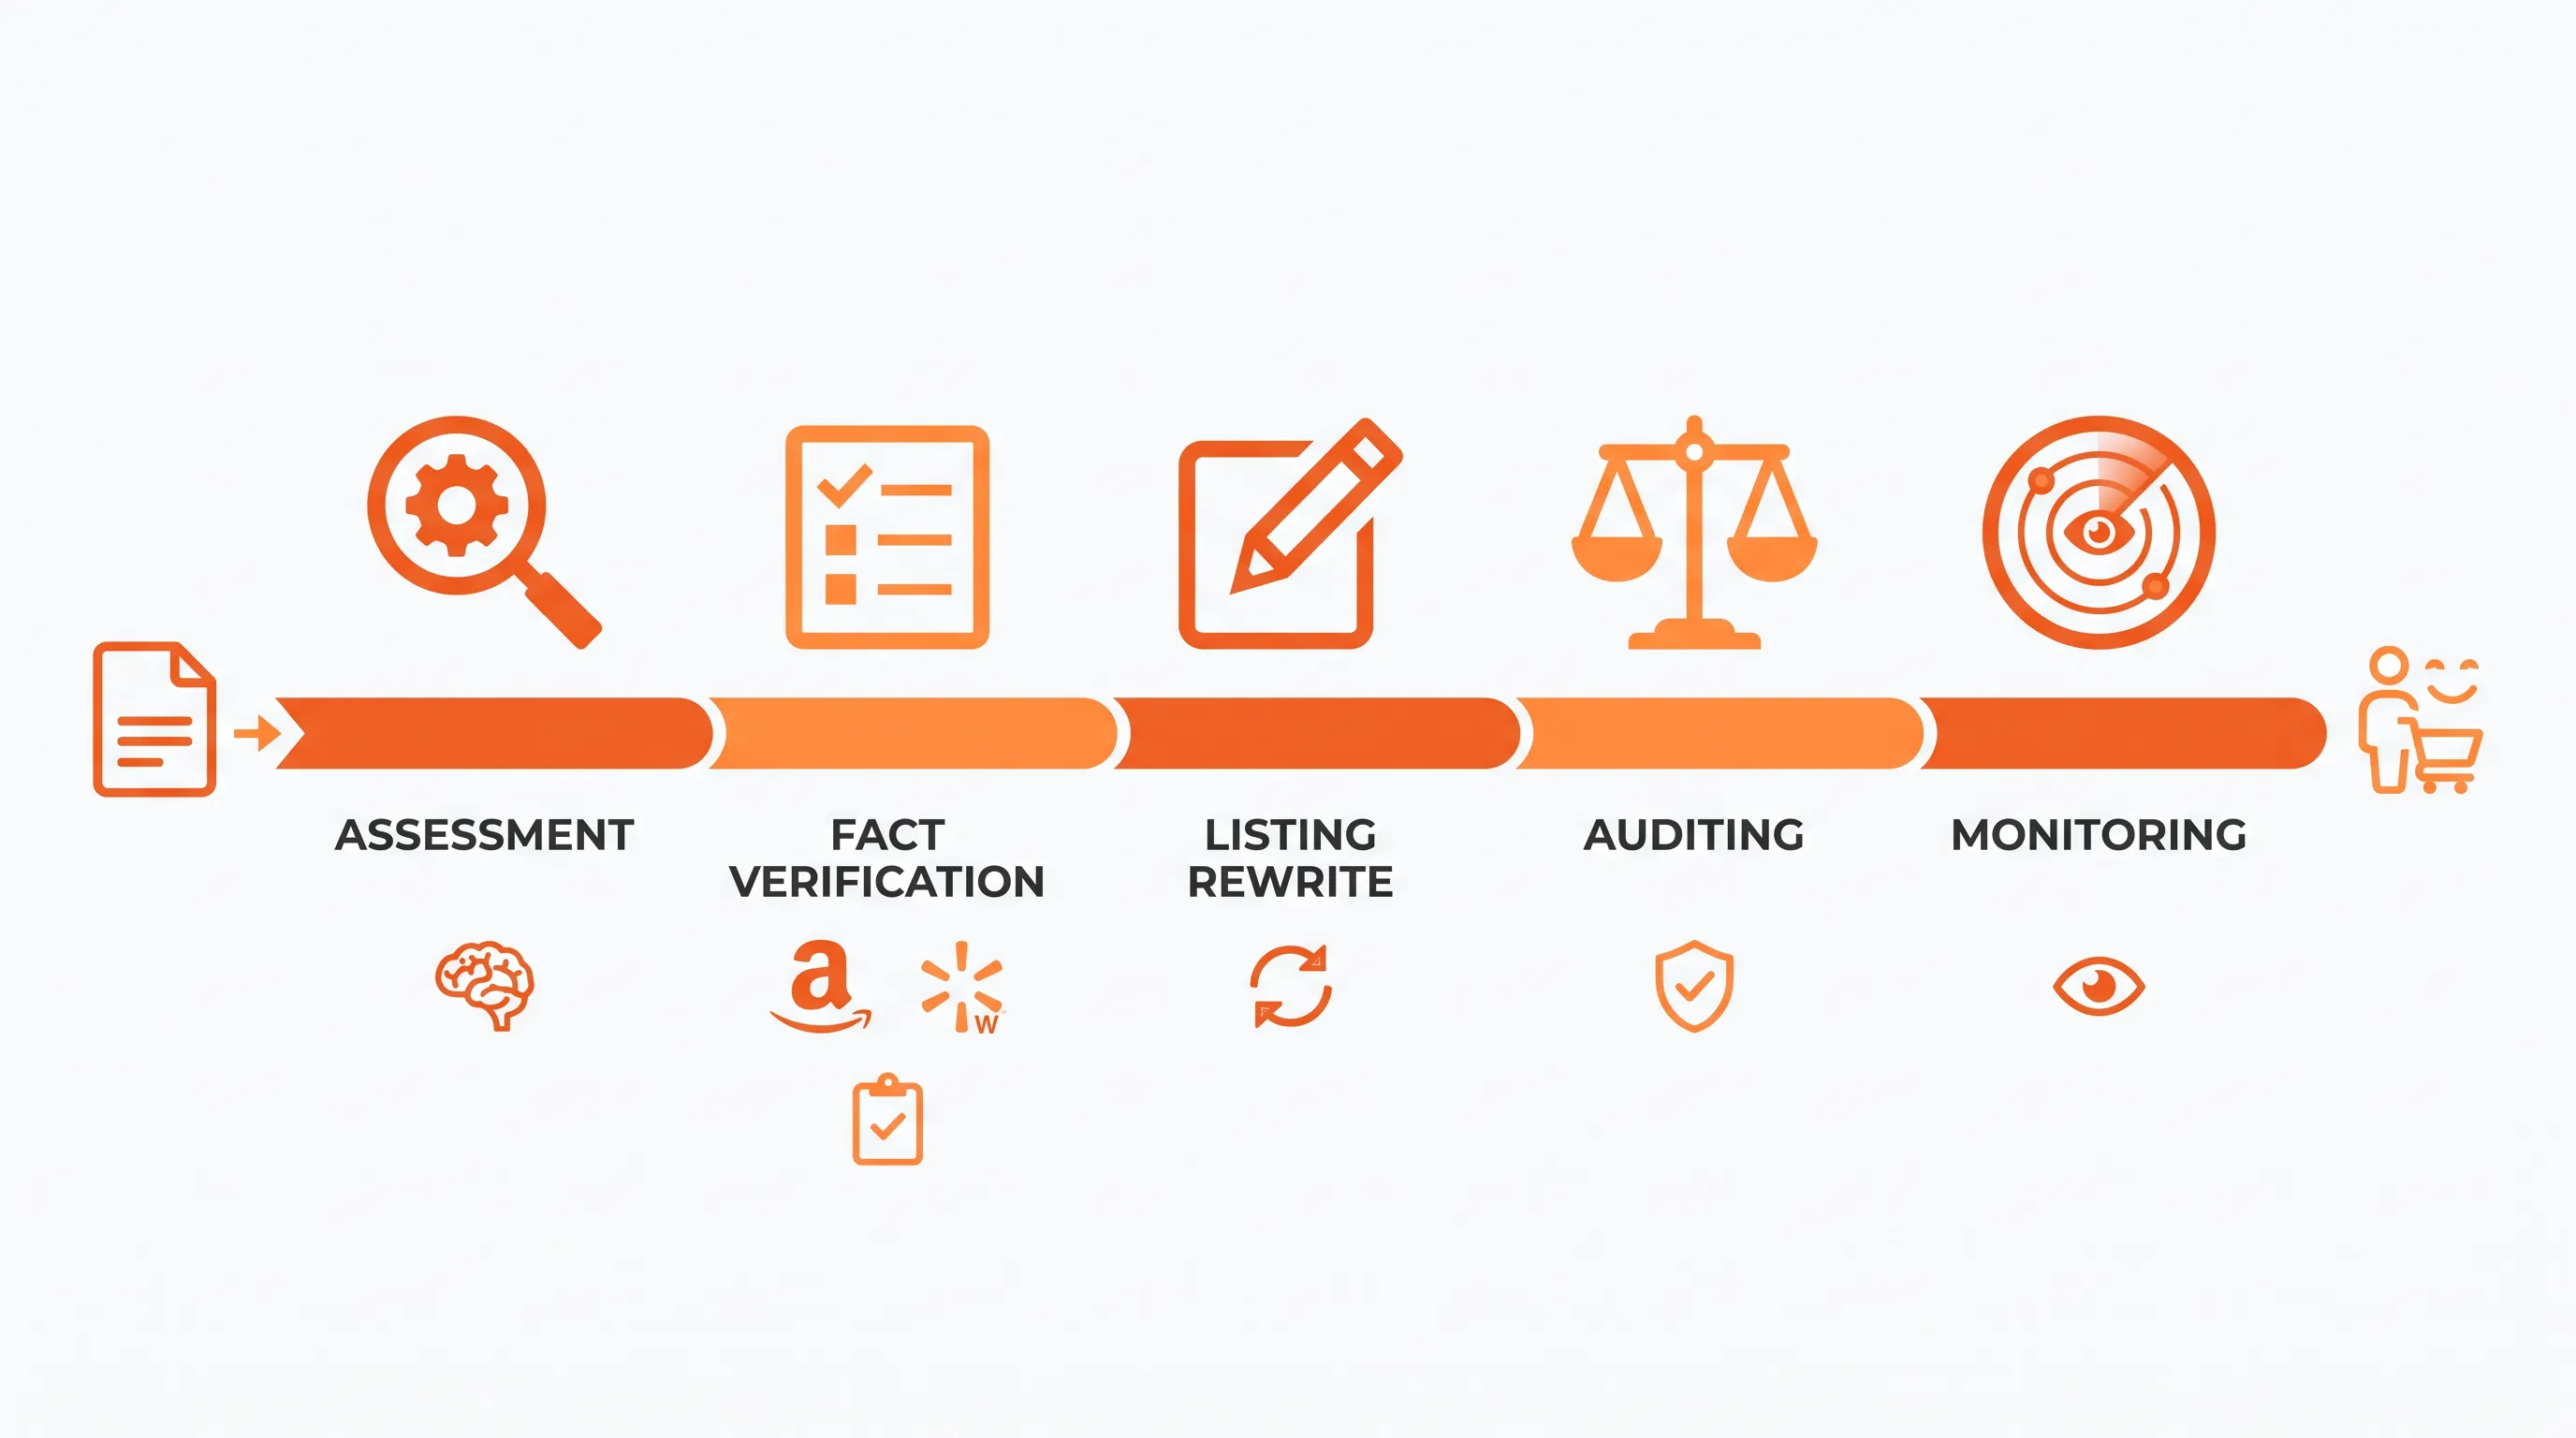
Minimalistic flow-based process illustration on a white background, featuring five icons for optimization stages with ample negative space.

How to optimize marketplace listings for AI search across Amazon and Walmart

This article gives you a repeatable workflow for improving how your products get found and recommended by Amazon's Rufus and Walmart's Sparky. It walks through baselining and rewriting each marketplace's fields on its own terms.

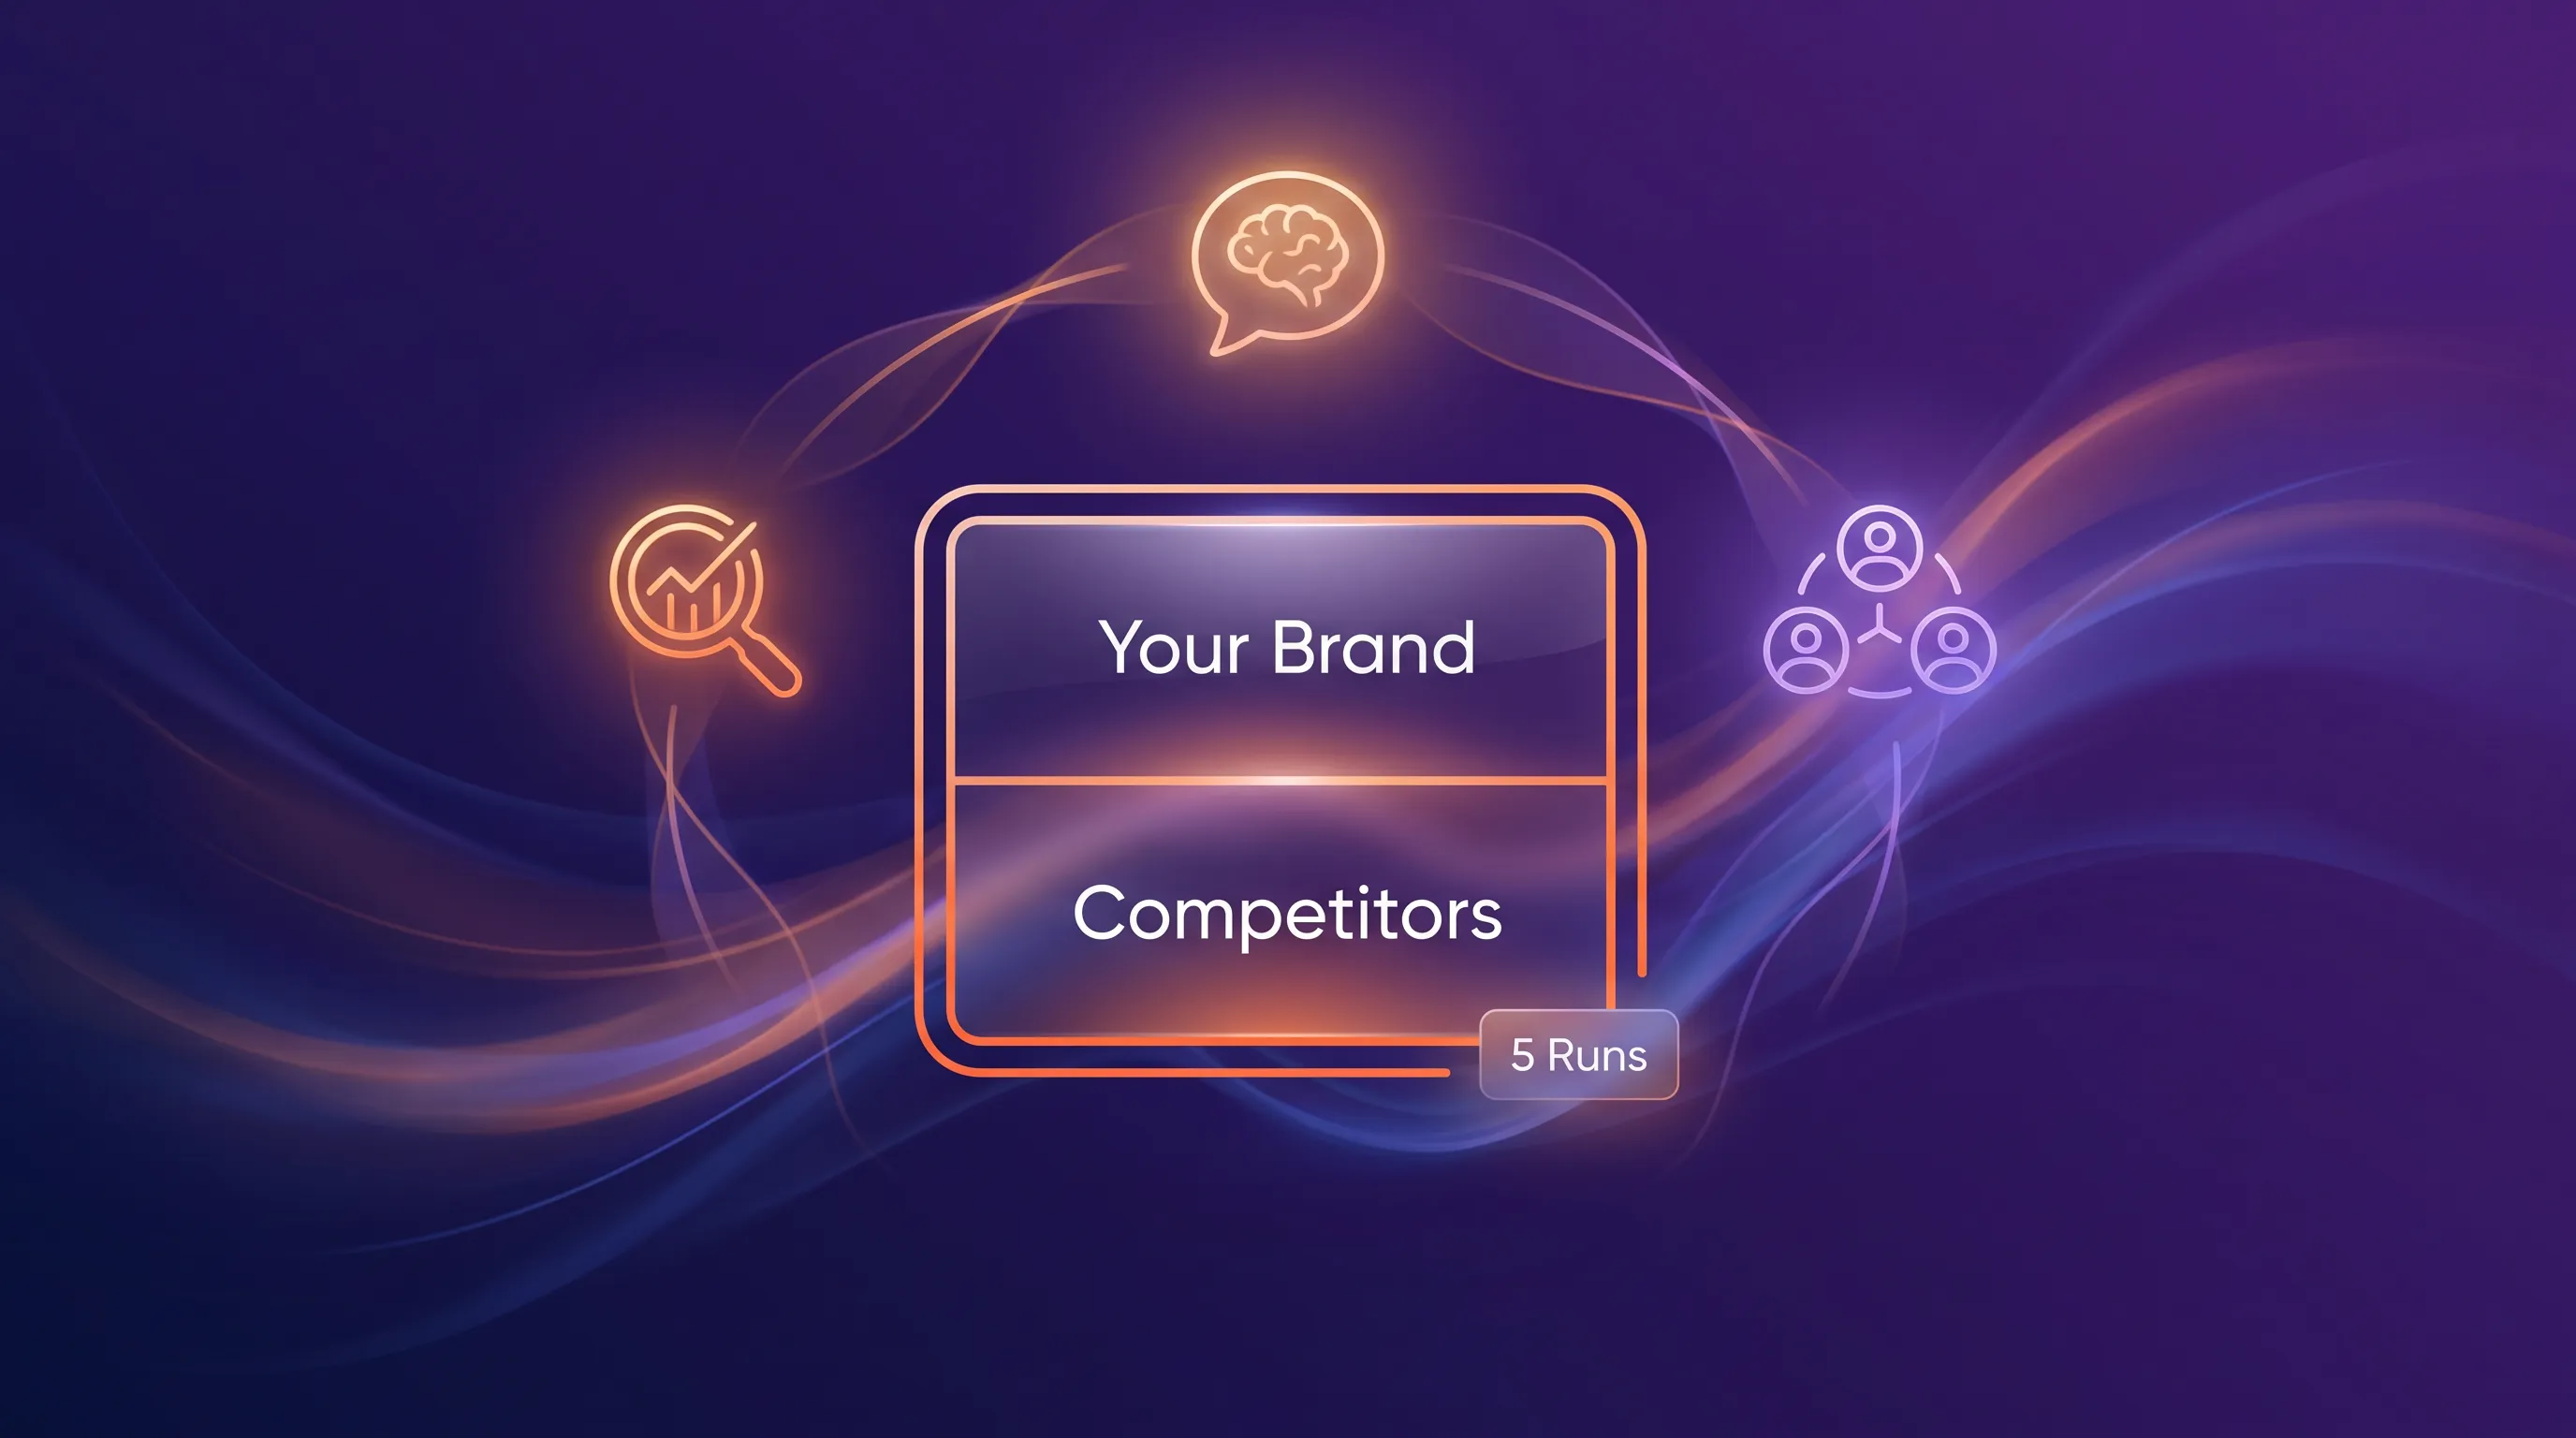
Minimalistic illustration of a sleek scorecard icon divided into 'Your Brand' and 'Competitors', surrounded by glowing line icons.

Benchmarking Brand Visibility in AI Answers Against Competitors

A benchmark of brand visibility in AI answers runs one fixed prompt set across chosen AI platforms and scores how often each brand appears and how it's described. You compare your brand against named competitors under identical conditions across repeated runs and treat differences as priorities rather than trivia.

A bold AI assistant icon at the center, surrounded by negative space and a sparse ring of simplified brand icons in vibrant orange.

AI Visibility Diagnostic: Why Assistants Overlook Your Brand

Assistants overlook your brand for one of four reasons: your content doesn't answer the questions buyers actually ask or your pages can't be crawled or read. Positioning that confuses the model about what category you're in and third parties that validate competitors instead of you belong on that same list. A structured prompt audit tells you which one before you spend anything.

A minimalistic illustration of a segmented arrow representing the citation readiness process for AI search engines, featuring sleek icons.

First AI SEO Steps to Make Content More Citation-Ready

Pick a small set of commercially valuable pages and score each one for clarity and accessibility. Fix only the lowest scores. Citation readiness means a page is easy for an AI engine to find and quote. You raise the odds of being cited. You never guarantee it.