Best LLM Visibility Tools: How to Evaluate the Right Platform

Content authorArtem Lozinsky, EMBA, MScPublished onReading time10 min read
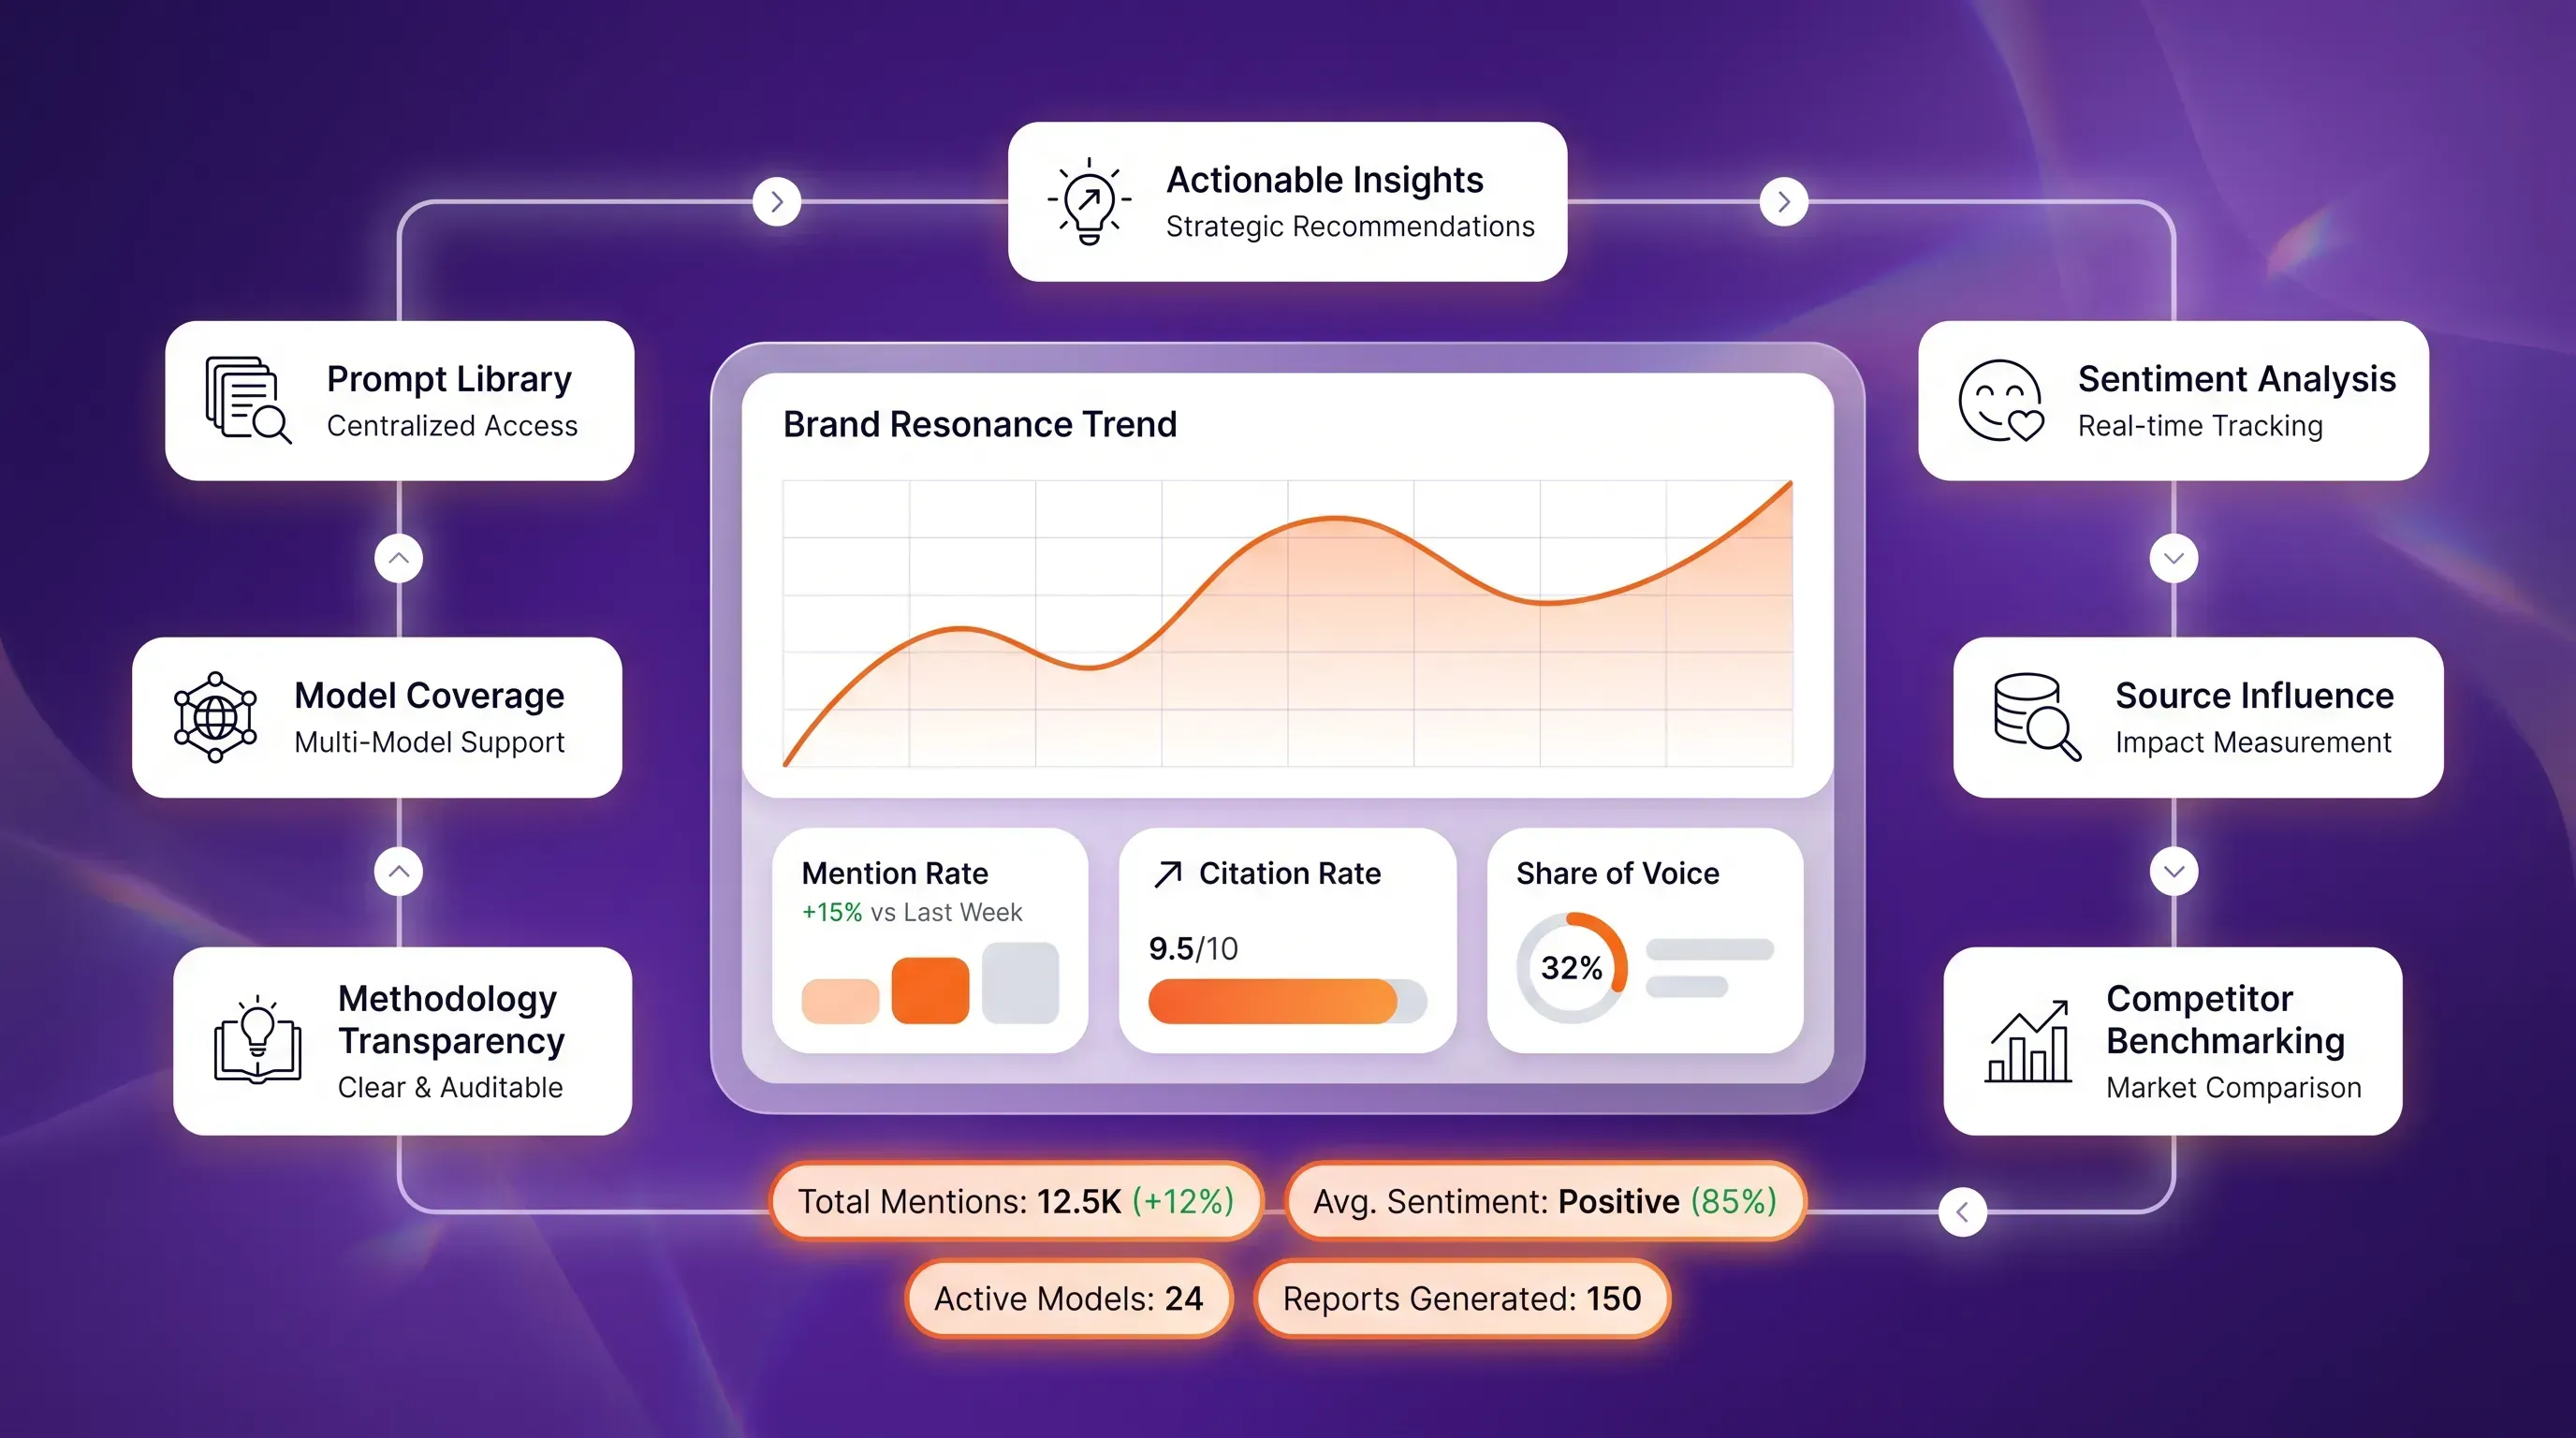
Luminous abstract SaaS dashboard featuring a central card with a line chart and rounded bar widgets, set against a deep purple gradient.

LLM visibility tools track how AI answer systems describe your brand, which competitors appear, and which sources they cite for a fixed prompt set. Choose a platform based on the job: executive reporting, competitive research, analyst review, or page-level optimization. Compare finalists using the same prompts and evaluation criteria.

What LLM visibility tools do

An LLM visibility tool is software that prompts several models at scale and reports whether your brand shows up and how prominently it appears in the answers. Instead of one person opening ChatGPT and typing a question, the tool runs hundreds of queries across engines on a schedule and logs every result.

You've already noticed the shift, and LLM visibility tools exist because of it: buyers now ask ChatGPT and Google AI Overviews for recommendations instead of clicking through ten blue links. G2 found that 51% of B2B software buyers now start their research with an AI chatbot more often than with Google, and 69% chose a different vendor than they had planned based on that guidance. A single answer shapes perception before anyone reaches your site.

That's why rank tracking and traffic reports no longer tell the whole story. Ahrefs measured that AI Overviews cut clicks to the top organic result by 58% by December 2025. And the same query produces different brand descriptions across models, because each one reads from a different index. So how does a team actually see and measure any of this?

Manual spot-checking breaks down fast. You type a prompt on Monday, screenshot a good answer, and by Wednesday the model has re-ranked its sources and dropped you. One check tells you nothing about the trend, and it covers one model on one day. A dedicated platform in the llm visibility tools category removes that guesswork by sampling consistently and storing the history.

The distinction you have to hold onto is between three different things a model can do with your brand:

  • A mention: the model names your brand in an answer, which signals awareness.

  • A citation: the model surfaces a specific URL of yours as a source, which signals trust.

  • A recommendation: the model actively suggests your brand as the answer to a buying question.

Each maps to a different buyer moment. Confusing them is where most misreadings begin.

LLM visibility tools at a glance

Platforms frequently shortlisted in this category include Profound, Peec AI, Otterly.AI, Scrunch AI, AthenaHQ, and AI features within broader SEO suites. Their coverage and packaging change quickly. The table below defines the comparison, not a permanent ranking.

CapabilityWhy it mattersProof to request
Engine and market coverageResults differ by product, language, and locationCurrent supported-engine and region list
Prompt controlsStable prompts make trend data interpretableExact prompt, schedule, locale, and model record
Raw answer evidenceAnalysts need to verify dashboard summariesExportable answer text, timestamps, and URLs
Citation analysisCited sources reveal evidence and distribution gapsSource-level history and owned/unowned classification
Competitor comparisonShare metrics need a consistent category setEditable competitor set and calculation method
Page-level recommendationsFindings should lead to owned-site workClear mapping from prompt to page and evidence
Data accessMature teams need reuse and auditabilityCSV export, API, retention, and permission model

Need help with your AI visibility?

Book a free consultation with our experts we'll help you determine exactly which services your organization needs.

How LLM brand monitoring works

Before you trust a vendor's dashboard, understand how the number gets made. LLM brand monitoring is a repeatable process of sending fixed prompts to models and counting what appears in the responses. The value of the data depends entirely on how transparent the vendor is about that process, so treat transparency as the throughline when you evaluate any llm visibility tools vendor.

Why models disagree

Ask the same question across major answer engines, and you get different answers about your brand. That happens because each model draws on a different index and applies its own reranking. Semrush analyzed 150K citations across those engines and found that only 11% of domains were cited by both ChatGPT and Perplexity.

Two sources feed any mention. One is training data, the parametric knowledge baked into the model. The other is retrieval augmented generation (RAG), where the system pulls documents at query time and feeds them into the answer. Perplexity leans hard on live retrieval and cites Reddit in 46.7% of answers, while ChatGPT historically leaned on Wikipedia and its own training. Monitor one model and you get a distorted picture. Covering several is the entire point.

Build a representative prompt set

Start with customer language, not a keyword export alone. Include five prompt types: category discovery, problem diagnosis, comparisons, implementation questions, and direct brand questions. Add enough variation to reflect real journeys, but remove prompts that ask the same thing with cosmetic wording.

Assign each prompt to a market, audience, funnel stage, target page, and competitor group. Freeze the set for the measurement period. When the set changes, create a new version and preserve the old baseline; otherwise the visibility trend can move simply because the test changed.

AI visibility data is a sample, not a census of everything users ask. Freeze the prompt text, engine or surface, language, location, and run schedule; retain the raw answer and citations; and re-baseline after a material model or product change. A tool that does not expose those variables may still be useful for trend monitoring, but its score should not be treated as an absolute market share.

Need help with your AI visibility?

Book a free consultation with our experts we'll help you determine exactly which services your organization needs.

Metrics that actually matter

Every dashboard offers more numbers than you can act on. The filter you need separates signal from vanity, so that when you present to a CMO or a client, each figure ties to a decision rather than a feeling. Here are the metrics that consistently earn their place.

Mention and citation rate

Mention rate is how often your brand appears across the tracked prompts. Citation rate is how often a specific URL of yours is surfaced as a source. The gap between them is diagnostic. A high mention rate with a low citation rate means models know you exist but don't trust your pages enough to cite them.

Mentions signal awareness. Citations signal source reliance, which matters because Seer Interactive found that pages cited in an AI Overview earn roughly 2.1% CTR against 0.9% for uncited pages on the same result. Teams that conflate the two metrics misread their own position because they celebrate awareness while they quietly fail the trust test.

Share of voice and position

Share of voice is your visibility relative to named competitors across the same prompt set. Position is where you appear inside an answer, and earlier mentions carry more weight because that's what a rushed buyer reads first. Together they reveal competitive standing rather than raw presence.

Raw presence can flatter you. Your brand appears in 40% of category answers and still trails a rival who appears in 70% and always lands in the opening sentence. This is the pair to benchmark against and report on quarter over quarter, because it answers the question a stakeholder actually asks: are we winning or losing ground against the names we compete with?

Sentiment and source influence

Sentiment is whether models describe you positively, neutrally, negatively, or inaccurately. An inaccurate description is a fixable problem, not just a bad score, because you can correct the source the model read. Source influence tells you which outside sources shape the answers about your category.

These two point straight at PR and content work. If a model repeats a wrong pricing tier or an outdated feature claim, you trace it to the page it came from and fix it there. And if 86% of AI citations still come from brand-managed and earned sources, source influence shows you exactly which doors to knock on.

A visibility score shows direction rather than an exact measurement. Read it as a shape over weeks, because the underlying answers shift as models re-rank and re-retrieve. Most llm visibility tools calculate a metric per model and then aggregate into one figure, which means a single-day swing is noise rather than signal.

Semrush watched ChatGPT's Reddit citations collapse from 60% to 10% in weeks after a serving change, and Wikipedia drop from 55% to under 20% at the same time. If your dashboard jerked around during that window, panic was the wrong response. Watch the trend line and treat the daily number with the skepticism it deserves.

Run a two-week proof of concept

  1. Load the identical prompt set into each shortlisted tool.

  2. Confirm language, location, engine, frequency, and competitor settings.

  3. Compare ten raw answers against the dashboard classification.

  4. Export mentions, citations, prompts, timestamps, and competitor results.

  5. Trace five recommendations back to the underlying answer and target page.

  6. Ask a second analyst to reproduce one report without vendor help.

  7. Score implementation effort, evidence quality, support, permissions, and total cost.

Reject a platform if analysts cannot explain how a score was produced or cannot retrieve the answer behind it. A smaller transparent dataset is more useful than a larger opaque one.

Keep search and AI measurement connected. Google says traffic from its AI features is included in Search Console's Web performance data, while OpenAI says ChatGPT referral links include utm_source=chatgpt.com for analytics tracking. Use Google's AI-features documentation and the OpenAI publisher FAQ to define what can be measured directly, then label prompt-panel scores as separate sampled observations.

Choose by operating model

An executive reporting team may prioritize stable trend views, permissions, and scheduled exports. An SEO team may value page mapping, citation discovery, and integration with search data. A brand team may need narrative accuracy and competitor share. An agency needs workspace separation, repeatable templates, and client-ready evidence. Write these needs before viewing demos so polished features do not replace the buying criteria.

Whichever platform you choose, retain a manual audit sample. Models and vendor classifications change; the raw evidence is the durable record.

Turning visibility gaps into action

Here's the payoff you came for. A dashboard nobody opens is wasted money, so the point of all this LLM brand monitoring is a decision your team can own. The workflow starts from a gap and ends at an action tied to a metric it will move.

Start with a competitor gap or a citation gap. Say your share of voice trails a rival on "best [category] for enterprise" prompts, and you notice the models keep citing a G2 listicle you're absent from. That gap is your brief. You now close it three ways, each tied to a metric:

  • Build content clusters around the buyer prompts you're losing; as models find more of your pages that answer those questions, mention rate will rise.

  • Earn mentions and citations on the third-party sources models already retrieve, because a Reddit thread or a G2 profile the model reads matters more than a page it never sees. This moves citation rate and source influence.

  • Fix inaccurate brand narratives at the source by correcting the outdated page or review the model quotes, which shifts sentiment.

Then confirm the change in your llm visibility tools dashboard over time. Because scores are directional, the meaningful signal is a trend line that bends over several weeks. That loop from gap to measured shift, with an owned action in between, is what justifies the effort to whoever signs off on it.

Need help with your AI visibility?

Book a free consultation with our experts we'll help you determine exactly which services your organization needs.

Define the decisions it must support, build a representative prompt set, name the competitors and markets, and specify the raw evidence you need. Trial at least two products with the same inputs before comparing scores.

They may use different prompts, models, search surfaces, locations, run times, weighting, deduplication, and definitions of a mention or citation. Compare methodology and raw answers before comparing headline scores.

Keep a stable core for trend continuity. Review it monthly or quarterly and after product, market, or model changes; add or retire prompts in a documented batch so the baseline remains interpretable.

Yes, for a small sample. Run a documented set of prompts manually, preserve complete answers and citations, and repeat on a fixed schedule. Paid tools mainly improve scale, consistency, storage, comparison, and reporting.

Use mention rate, citation rate, share of voice within the sampled set, accuracy of brand description, source domains, and movement by prompt segment. Connect those observations to referral traffic, organic performance, qualified leads, and conversions rather than optimizing the score in isolation.

Schedule a Meeting

Book a time that works best for you

You Might Also Like

Discover more insights and articles

Minimalistic abstract SaaS marketing visual featuring a marketing team icon, split paths for 'SEO' and 'GEO', and essential line icons.

How Marketing Teams Can Decide If GEO Fits Their Search Strategy

Fund generative engine optimization (GEO) when your buyers consult artificial intelligence (AI) answers during research and your high-value queries already return synthesized responses you can measure at the prompt level. If any one is missing, fix the gap first. GEO is an addition to search investment.

Minimalistic SaaS marketing visual featuring a bold orange flow arrow connecting icons for exposure, traffic, and brand discovery.

How to Measure Whether Google AI Overviews Improve Brand Discovery

Measure discovery. Track how often your brand is cited and named inside AI Overviews and how your presence compares with competitors on the same queries. Then check whether branded search and revenue move in the same direction over the following weeks.

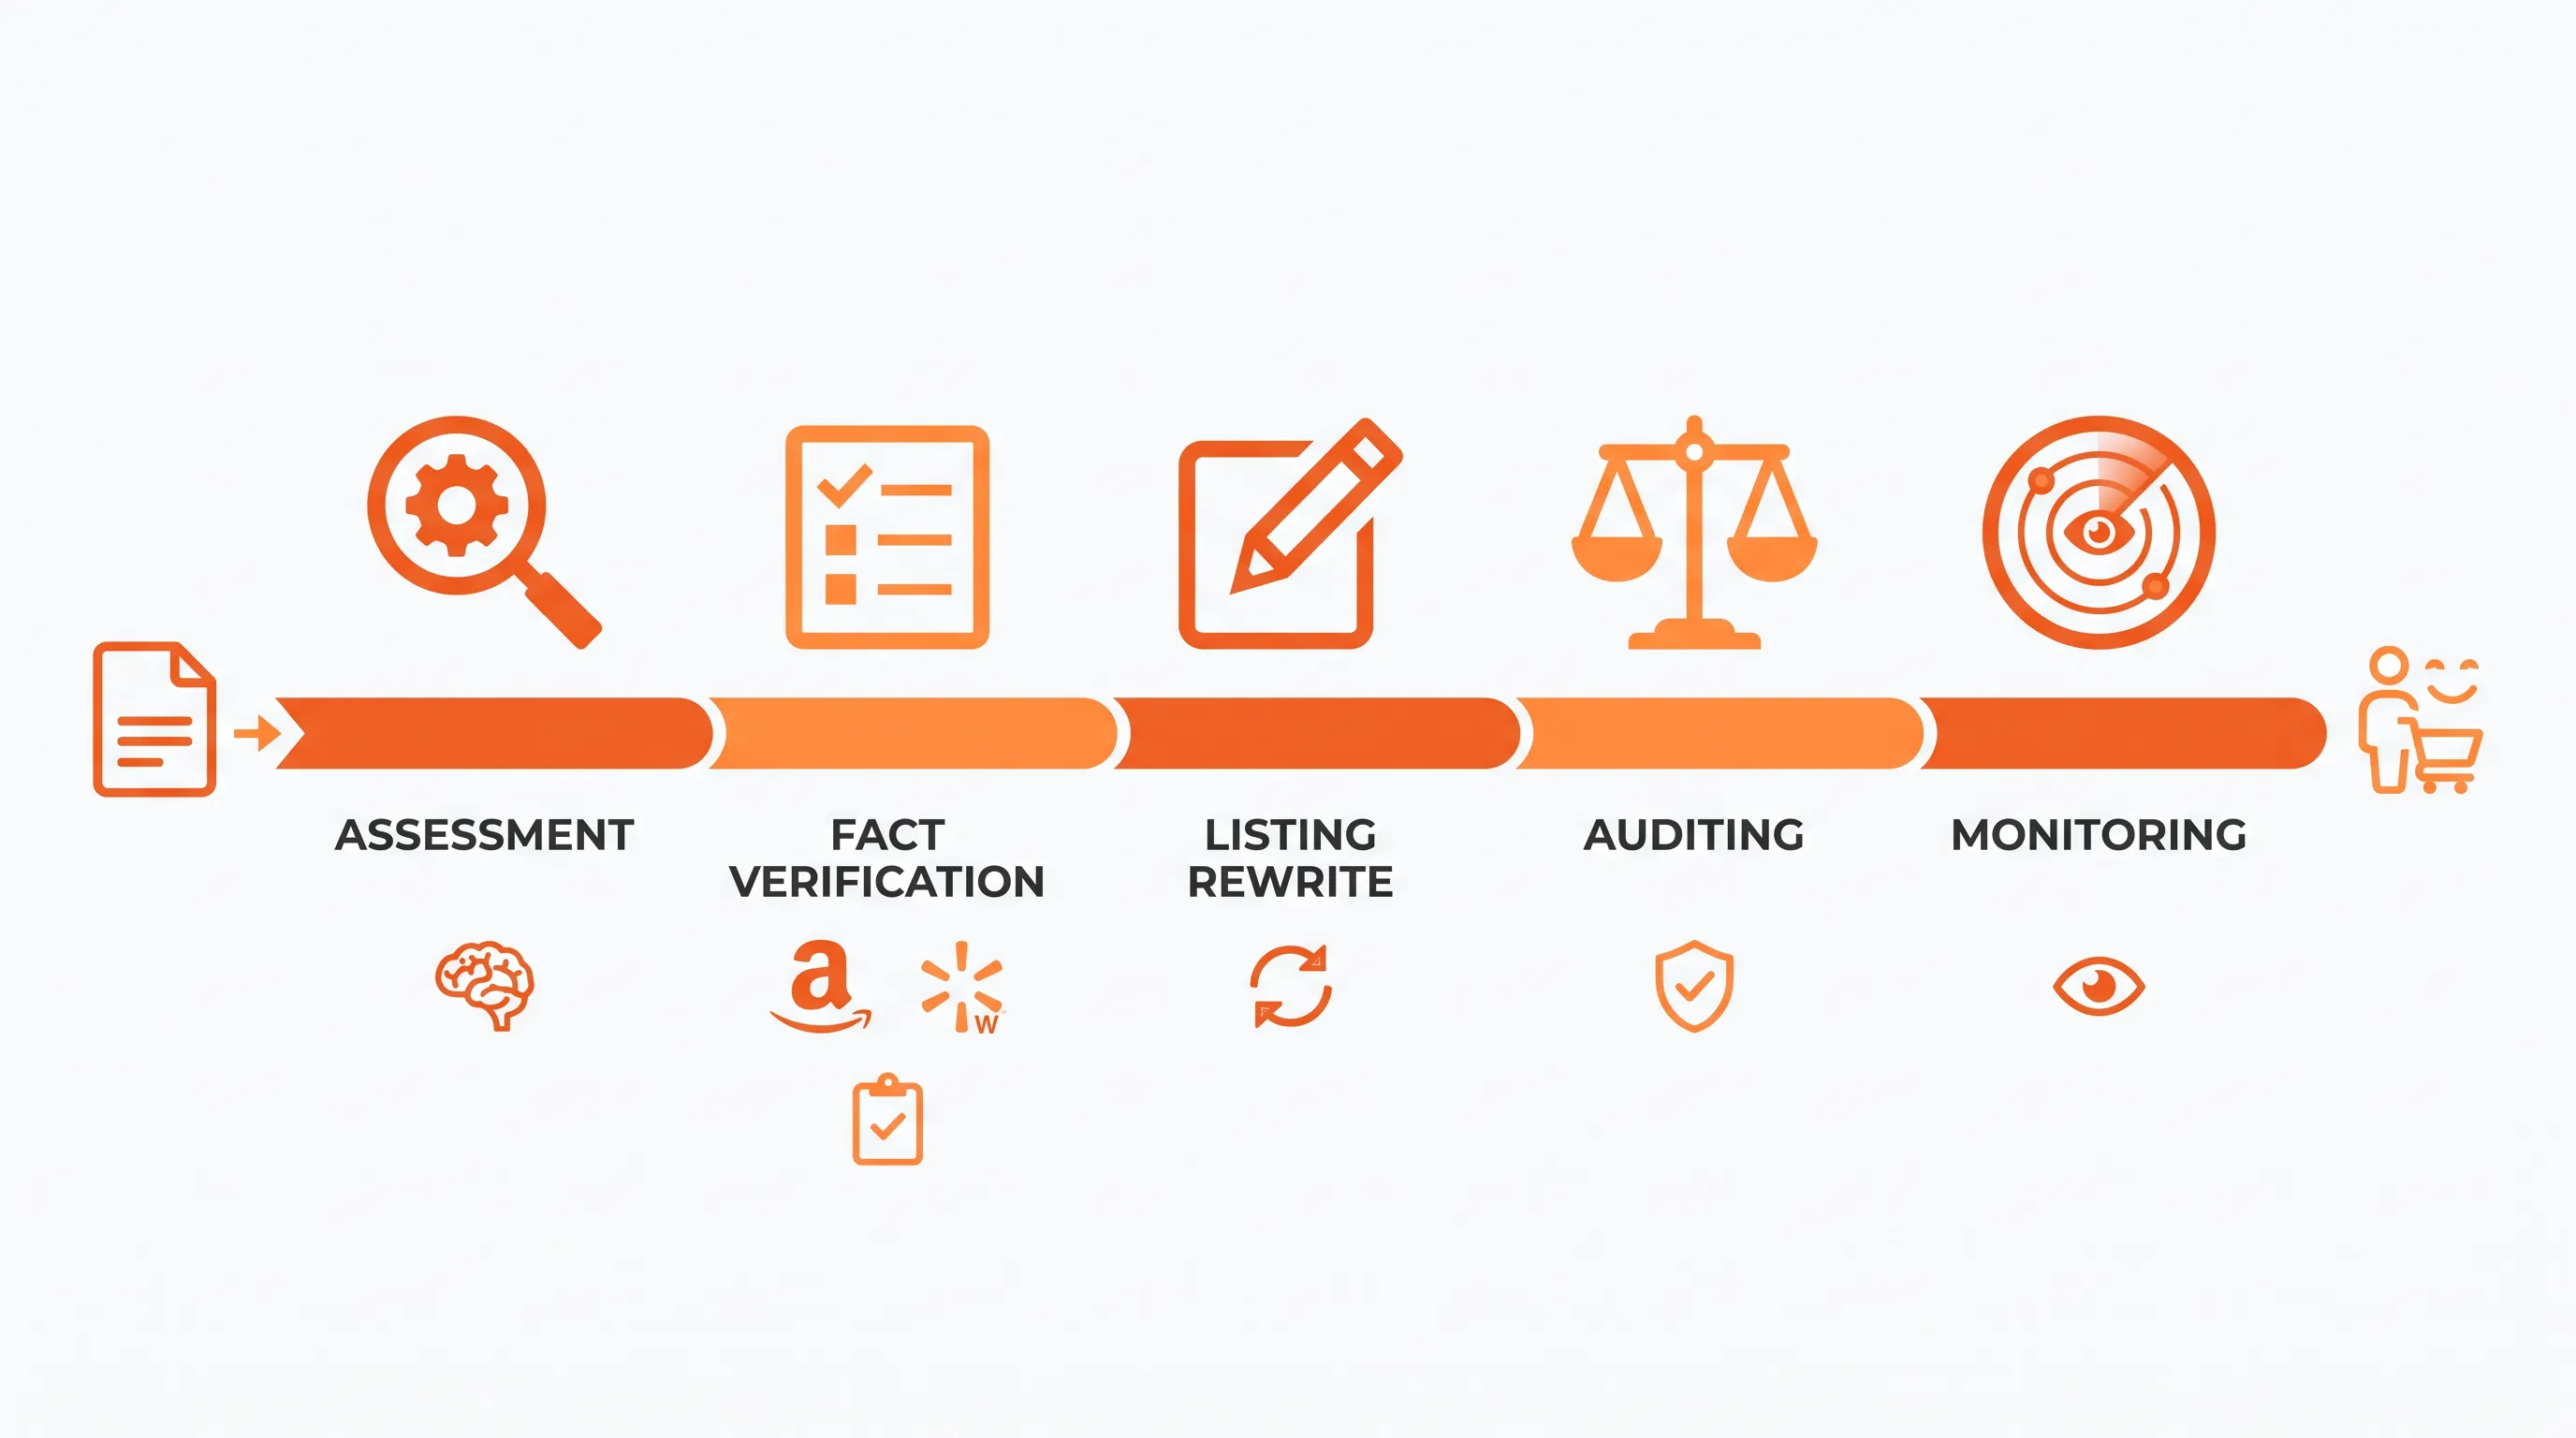
Minimalistic flow-based process illustration on a white background, featuring five icons for optimization stages with ample negative space.

How to optimize marketplace listings for AI search across Amazon and Walmart

This article gives you a repeatable workflow for improving how your products get found and recommended by Amazon's Rufus and Walmart's Sparky. It walks through baselining and rewriting each marketplace's fields on its own terms.

Minimalistic illustration of a sleek scorecard icon divided into 'Your Brand' and 'Competitors', surrounded by glowing line icons.

Benchmarking Brand Visibility in AI Answers Against Competitors

A benchmark of brand visibility in AI answers runs one fixed prompt set across chosen AI platforms and scores how often each brand appears and how it's described. You compare your brand against named competitors under identical conditions across repeated runs and treat differences as priorities rather than trivia.