Benchmarking Brand Visibility in AI Answers Against Competitors

Content authorJevgenia Pogadajeva, MBA, MScPublished onReading time10 min read
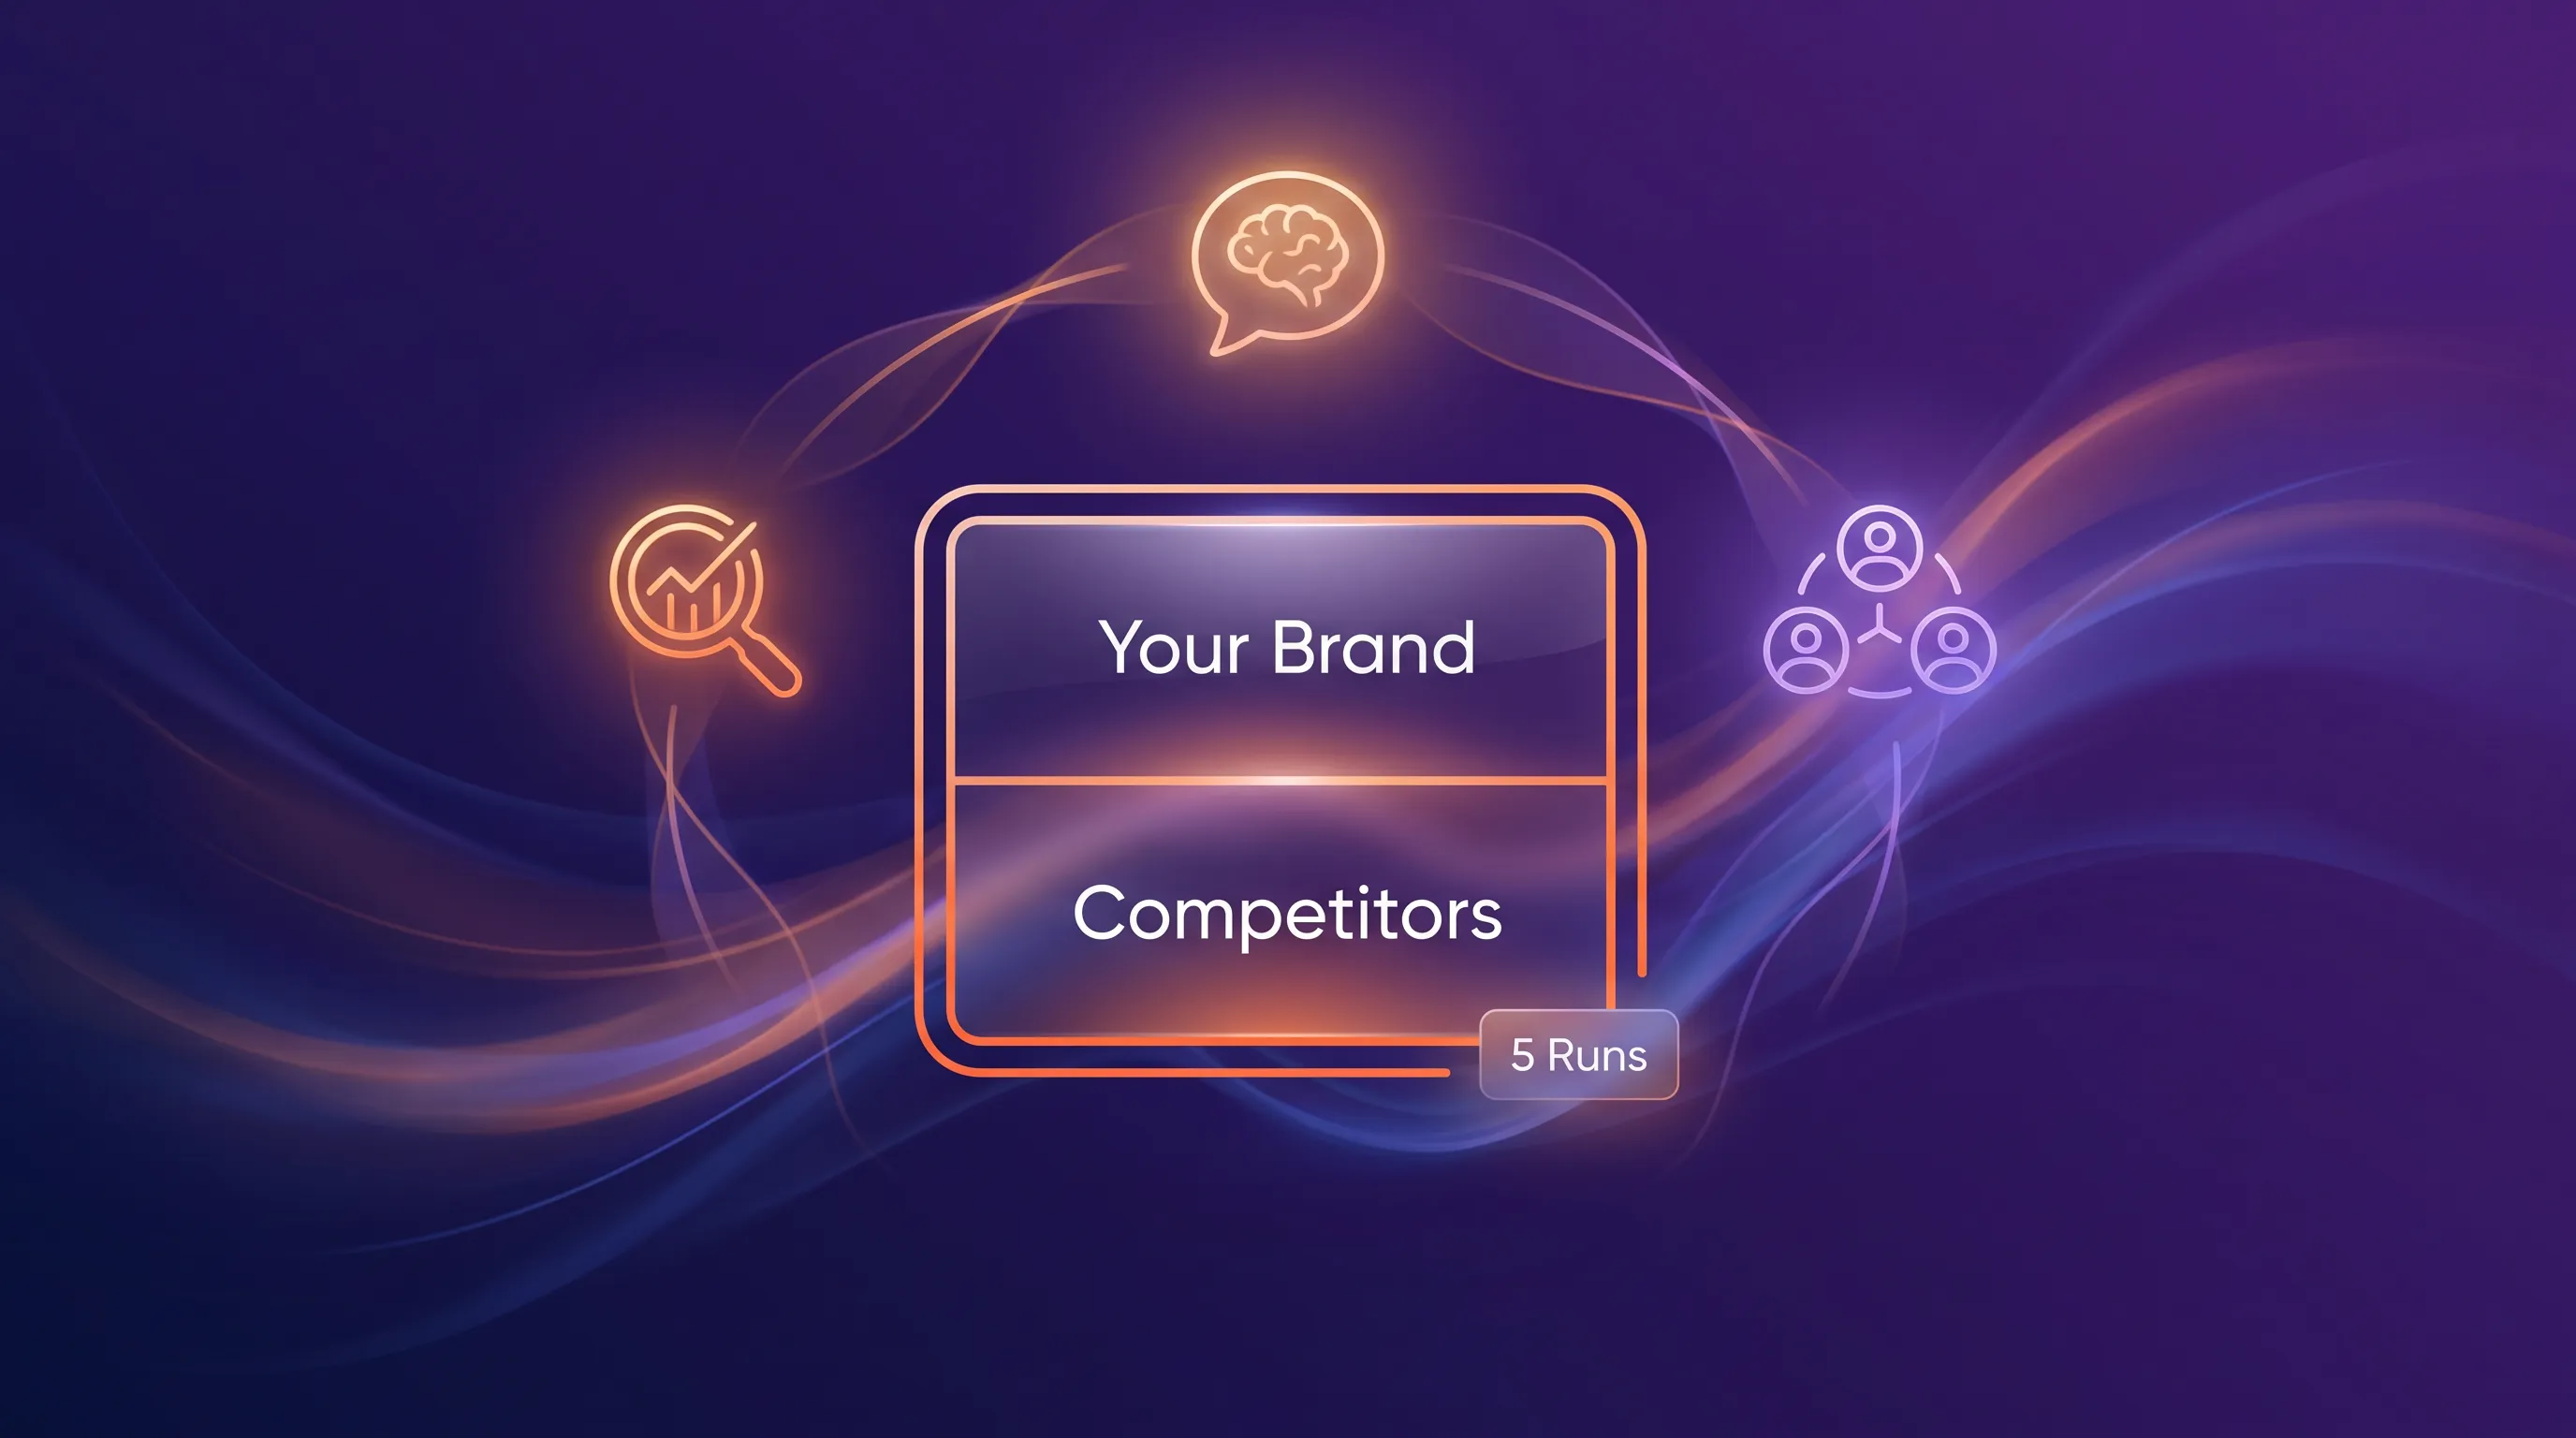
Minimalistic illustration of a sleek scorecard icon divided into 'Your Brand' and 'Competitors', surrounded by glowing line icons.

A benchmark of brand visibility in AI answers runs one fixed prompt set across chosen AI platforms and scores how often each brand appears and how it's described. You compare your brand against named competitors under identical conditions across repeated runs and treat differences as priorities rather than trivia.

What makes an AI benchmark useful?

A benchmark is useful when every brand in it faces the same prompts on the same platforms and the scoring uses the same rules on questions your buyers actually ask. Change one variable and the comparison stops meaning anything. That's the whole reason a single visibility percentage, produced from a handful of searches somebody ran on a Tuesday, can't guide a budget decision.

Conductor's analysis of AI recommendation consistency found that on comparison prompts naming brands upfront, the same brand leads the response 91% of the time. So AI answers have stable structure you can measure, and positions competitors hold are defended positions.

That stability cuts two ways, which is the part the study leaves unsaid. If a rival already owns the top slot on your category's comparison questions, occasional wins won't dislodge them. Your benchmark tells you which contests are winnable and which are trench warfare, because those get different budgets.

Which prompts should you compare?

Build your prompt set from the questions prospects ask while working out what to buy, and keep branded prompts to a small minority of the sample. A prompt set stuffed with "is [your brand] good" will flatter you and teach you nothing. Category questions and the awkward comparison ones are where models choose freely between brands.

Peec AI analyzed 37,804 AI responses across 5 LLM engines and found brand visibility stayed stable as long as prompts held above roughly 0.50 to 0.60 cosine similarity in meaning. Wording variants matter less than intent.

Which means you need coverage across distinct intents, because a prompt that drifts in meaning is a different competitive contest with a different winner. Spend your prompt budget widening the map instead of rephrasing the same corner of it.

Which buyer intents need coverage?

Cover the full arc of the decision, because a mention inside a purchase recommendation is worth more than a mention inside a definition. Segment your scoring by intent so those two never get averaged together.

Your set includes:

  • Category discovery and problem-framing questions, where the buyer doesn't know the vendor landscape yet

  • Feature and comparison questions, plus reputation and purchase-intent questions like "which X should I buy for Y"

Conductor's same intent analysis found that depending on the engine, 45% to 72% of education prompts returned no brand names at all. Informational visibility is thin by design.

Read that as a resourcing signal. Educational content still earns the topical standing models draw on elsewhere, but if you score it alongside recommendation prompts you'll bury your real commercial gaps under answers that were never going to name anyone.

Which topics deserve representation?

Map prompts to the products and use cases you actually want to win, then give the strategically important ones enough prompts to show up in the data. Broad high-volume themes will otherwise swallow the niche where your margin lives.

One brand frequently holds around 37% of mentions in a topic while dozens of others split the remainder, according to Wellows' 2026 audit guidance. Concentration is the norm.

Here's the implication for your prompt allocation. If a rival owns a third of a broad topic, a category-wide average will read as defeat even when you dominate three specific use cases that convert. Topic-level scoring separates a market you've lost from a market you never contested.

Need help with your AI visibility?

Book a free consultation with our experts we'll help you determine exactly which services your organization needs.

Which competitors belong in the benchmark?

Include your direct commercial rivals and the category leaders buyers name unprompted, then add any brand the models keep surfacing that nobody on your team expected. Keep those three as separate groups so you're never averaging a $2B incumbent against a two-year-old challenger.

A 37,000-run audit across 533 brands in five prominence tiers found category leaders reach nearly every relevant retrieval but convert only 25% to 41% of the recommendation slots they appear in. Challengers converted better, at 37% to 52%.

That gap is the most useful number in this whole exercise. Being retrieved and being recommended are separate achievements, and the brands closest to your size are converting retrieval into recommendation more efficiently than the giants. Group them separately or you'll copy the wrong playbook.

Which signals show competitive strength?

Score presence and quality as two different things, because a brand can be mentioned constantly and still be described in ways that lose the deal. Then write the scoring definitions down and have every person classifying answers use the same ones.

Citation status is the sharper predictor here. In the co-occurrence data compiled by 5WPR, brands that appeared on a cited page kept a recommendation 75% of the time, while uncited brands kept it only 13%.

So presence without supporting evidence is fragile presence. A mention your benchmark records as a win one week can evaporate the next if no cited source backs it up, which is why your scorecard needs a citation column sitting right beside the mention column rather than in a separate report nobody opens.

How often is each brand included?

Calculate inclusion as the number of answers naming a brand divided by the eligible answers for the same prompt set, then log prominence or recommendation status on top of it. Binary presence hides too much.

Mention rates move on their own. A brand can hold a 40% mention rate one week and 25% the next without publishing a single page, purely from sampling and retrieval drift, as Visiblie's analysis of answer variability describes.

That swing is larger than most quarterly targets, and it settles the debate about one-off audits. Any inclusion figure from a single pass through your prompts is one sample from a distribution, so report it as a rate across repeated runs or don't report it at all.

How is each brand positioned?

Classify what the answer says. Record the attributes attached to each brand and whether the description is factually right.

Automated labeling has real error bars. Polarity classification runs at 82% to 88% accuracy in production, per the EdgeDelta benchmarks ZipTie cites, with fine-tuned models reaching 91% to 95% only under controlled conditions.

Which is why recurring phrasing beats the label. "Strong for enterprise compliance" and "pricier than alternatives" both classify as neutral-to-positive, yet they do opposite things to a shortlist. Store the sentence that justified each score, because the phrase repeating across answers is the narrative you're actually competing with.

Which brands and sources get cited?

Track citations as their own metric family: your own domain and third-party domains. Mentions tell you the outcome, and citations tell you the mechanism.

Source overlap between engines is minimal. A study of 22.7 million citations across five models found 79.6% of cited sources appeared in only one model, and models agreed on the same brand 30.3% of the time while landing on the same page just 6.8%.

Your citation strategy therefore can't be one strategy. The brand consensus is far more portable across platforms than the page consensus, so the review sites and roundups feeding one engine are probably invisible to another, and a per-platform citation column is the only way to see it.

Need help with your AI visibility?

Book a free consultation with our experts we'll help you determine exactly which services your organization needs.

A scorecard makes comparisons actionable

Put one row per brand and one column per metric, then keep the prompt-level evidence behind every number you summarize. A scorecard nobody can audit gets argued with instead of acted on.

The columns worth holding are these:

  1. Prompt inclusion rate and recommendation rate

  2. Citation rate and consistency across repeated runs of the same prompt

On free-choice recommendation prompts, certain brands showed up in 90% to 100% of recommendation runs across all four engines Conductor tested. That's earned, repeatable dominance.

Treat consistency as its own column. A brand at 95% inclusion and a brand at 45% look similar in a single screenshot, but only one of them is reliably in the consideration set, and the scorecard is where that difference becomes visible to whoever controls the budget.

How should metrics be weighted?

Weight high-intent prompts and explicit recommendations above the rest, then document the weights and keep the raw counts alongside the weighted score.

The commercial case for that weighting is in the traffic quality. Similarweb's 2026 cross-site analysis put the AI referral conversion rate at 11.4% against 5.3% for organic search, a 2.15x premium.

Visitors arriving from an AI answer have already narrowed their options, so the prompts that shape that narrowing deserve more weight than the ones that merely inform. Publish the weighting anyway. The moment a stakeholder suspects the score was tuned to produce a flattering number, the benchmark loses the authority you built it for.

What should the matrix reveal?

The matrix surfaces the uncomfortable cells first: prompts where competitors appear and you don't, and mentions with no citation behind them. Every material gap gets a named owner and a proposed action.

Citations are where the intervention lands. In TrustRadius's 2025 B2B buying study, 90% of buyers who saw AI Overviews clicked at least one cited source.

An uncited mention is a cell to fix, because the answer sends its traffic and its credibility to whoever supplied the evidence. Rank your gaps by whether a cited source exists, and you'll find the work sorts itself into content you publish versus authority you have to earn elsewhere.

Repeatability makes trends credible

Freeze everything you can: the prompts and platforms. Then run each prompt multiple times, because a single answer is a single draw from a noisy process.

A variance-components study published on arXiv in July 2026 found query language accounted for 26.5% of variance in brand answers while brand identity accounted for 1.5%. A repeat past the fifth run reduces relative-error variance by only 0.0003.

Five runs per prompt is enough. After that, extra budget belongs in more languages or more models. And treat small month-over-month movement as directional until it holds across two or three cycles, since the drift you're seeing is sampling rather than anything you did.

Benchmark gaps should set priorities

Rank gaps by commercial weight. A competitor consistently winning your highest-intent prompts outranks a wide but shallow deficit on informational questions every time.

Sort your findings into these buckets before assigning anyone work:

  • Content gaps, where no page of yours addresses the prompt, and authority gaps, where the cited sources belong to others

  • Positioning gaps and measurement gaps where your prompt set simply lacks coverage

Bain & Company's September 2025 research found that 85% of B2B buyers purchase from their day-one vendor list, made up of companies they already had in mind before searching.

That reframes the entire benchmark. AI answers are now one of the places the day-one list gets written, so absence from a recommendation prompt is a lost seat at the evaluation.

When does deeper tracking become necessary?

Manual benchmarking breaks down once you need five runs per prompt across several platforms. That's thousands of rows a month, and the spreadsheet stops being a measurement system around the point it becomes somebody's second job.

Snoika is an AI-first visibility and growth platform that monitors mentions and competitor presence across ChatGPT and Gemini. In June 2026 the company launched a free AI Visibility Monitoring feature for teams that want to see where they appear and where competitors are gaining ground, and its trial tier tests 10 prompts weekly on one platform with basic competitor tracking.

Start by running the prompt set you built here through the free monitoring check, then compare what it returns against your manual scorecard. If the two disagree, you've found your measurement gap before it distorts a quarter of decisions.

Need help with your AI visibility?

Book a free consultation with our experts we'll help you determine exactly which services your organization needs.

Set the baseline before the first production run, using the same prompt list, platforms, locales, and run count you’ll use later. Record the date, model versions, and collection method. Reuse that baseline until you intentionally change the study design, then create a new baseline instead of mixing results.

For every response, save the exact prompt, timestamp, platform, model or model version, locale, account state, raw answer, and cited URLs. Also record whether the response was generated from a fresh session. These fields help explain changes that brand scores alone can’t explain.

Keep each platform’s raw response, then map results into shared fields for presence, recommendation strength, and evidence. Compare those normalized fields across platforms, while preserving platform-specific details separately. This prevents layout differences from being mistaken for performance differences.

Keep zero-brand prompts in the dataset, but report them separately from prompts that produce a competitive shortlist. A zero-brand result measures whether the question triggers vendor retrieval. Removing it would inflate brand inclusion rates and hide changes in the model’s answer behavior.

Test a change against the variation across repeated runs, not against the previous percentage alone. Use confidence intervals or bootstrap estimates with the raw run-level data, and flag small movements as inconclusive until they persist across later collection cycles.

Schedule a Meeting

Book a time that works best for you

You Might Also Like

Discover more insights and articles

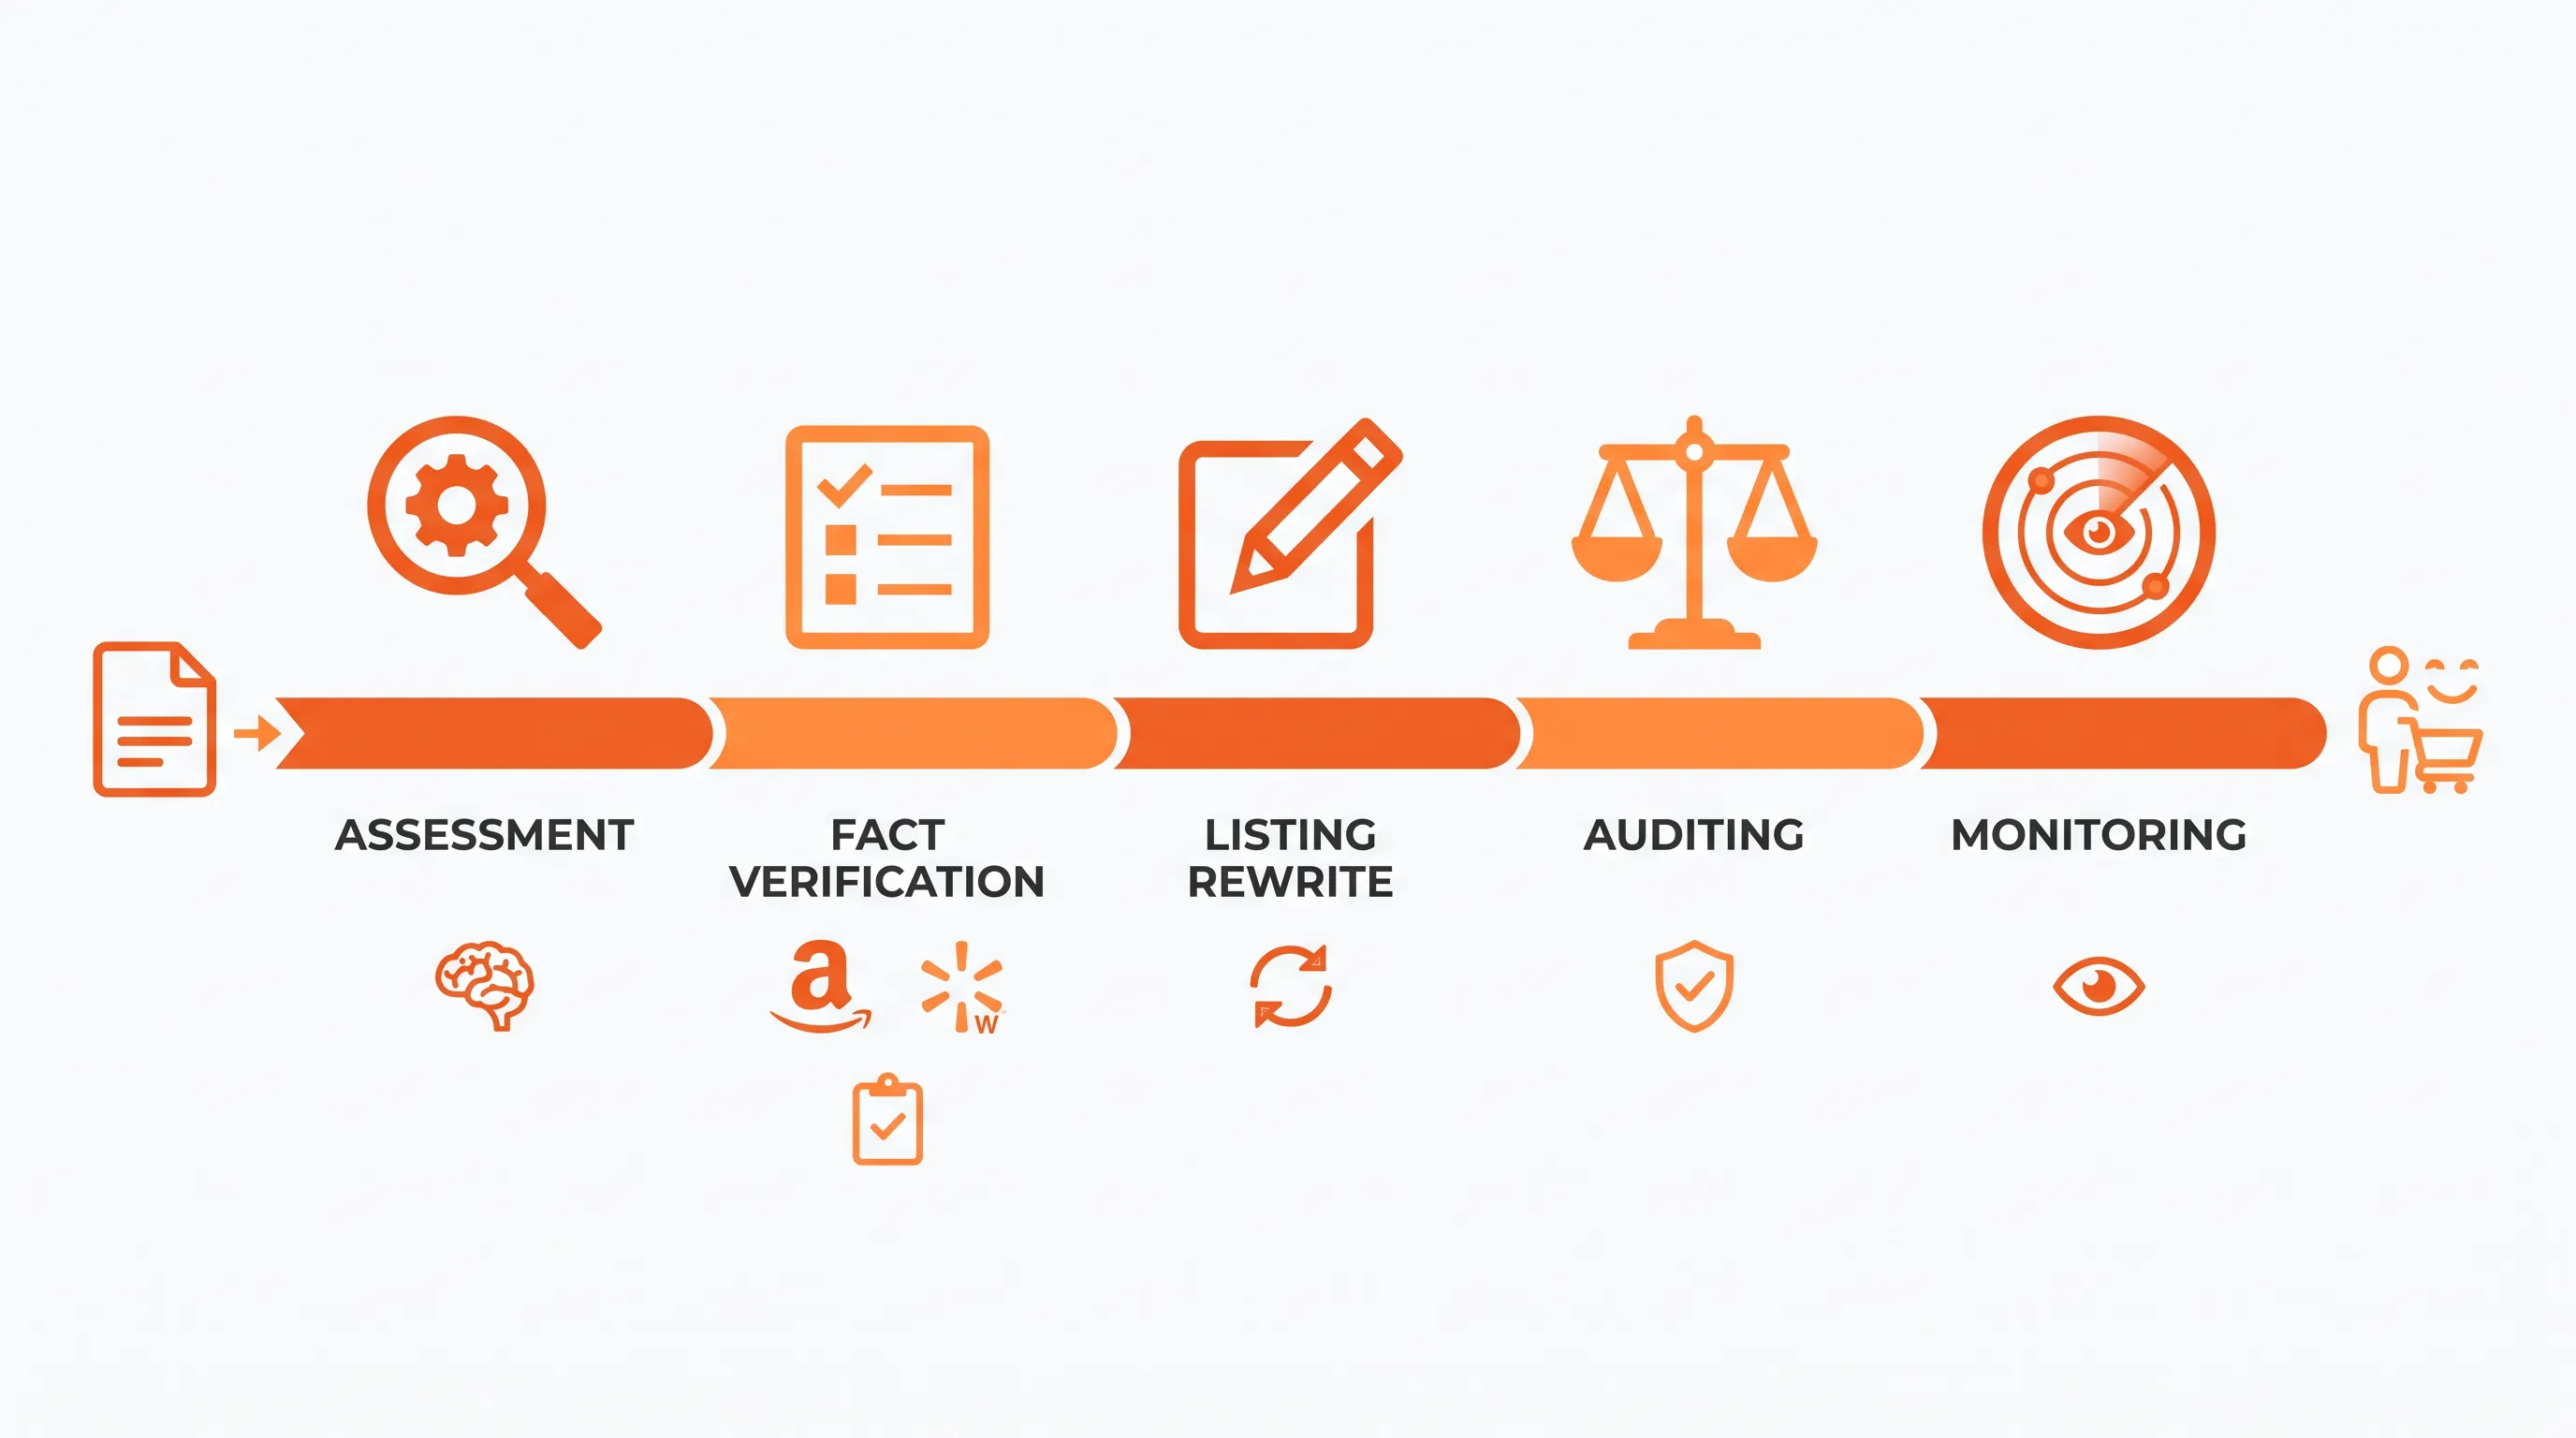
Minimalistic flow-based process illustration on a white background, featuring five icons for optimization stages with ample negative space.

How to optimize marketplace listings for AI search across Amazon and Walmart

This article gives you a repeatable workflow for improving how your products get found and recommended by Amazon's Rufus and Walmart's Sparky. It walks through baselining and rewriting each marketplace's fields on its own terms.

A bold AI assistant icon at the center, surrounded by negative space and a sparse ring of simplified brand icons in vibrant orange.

AI Visibility Diagnostic: Why Assistants Overlook Your Brand

Assistants overlook your brand for one of four reasons: your content doesn't answer the questions buyers actually ask or your pages can't be crawled or read. Positioning that confuses the model about what category you're in and third parties that validate competitors instead of you belong on that same list. A structured prompt audit tells you which one before you spend anything.

A minimalistic illustration of a segmented arrow representing the citation readiness process for AI search engines, featuring sleek icons.

First AI SEO Steps to Make Content More Citation-Ready

Pick a small set of commercially valuable pages and score each one for clarity and accessibility. Fix only the lowest scores. Citation readiness means a page is easy for an AI engine to find and quote. You raise the odds of being cited. You never guarantee it.

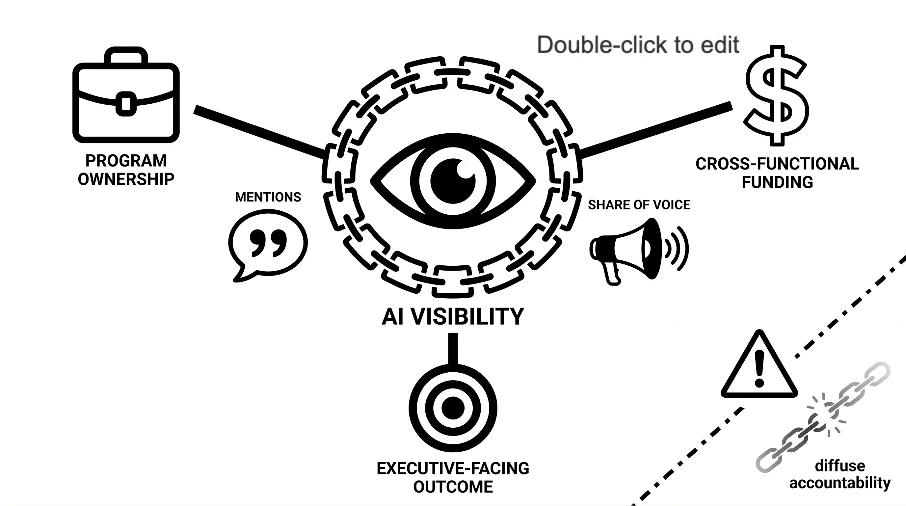
Black-and-white comic-style SaaS cluster diagram featuring an eye icon, briefcase, dollar sign, bullseye, and warning triangle.

Choosing the Right AI Visibility Term for Budget Planning and Team Ownership

Use "AI visibility" as the outcome word your executives approve against, then pair it with one operational term like GEO or AI search optimization for the tactics and the owner. The umbrella wins budget conversations. The specific term wins scoping conversations. Documenting what your chosen word covers matters more than picking the "correct" one.