An AI-driven marketing analytics dashboard showing automated KPI alerts and channel performance metrics across paid search, social, email, and SEO

The Role of Data in Modern Performance Marketing

Data is now the fuel of performance campaigns. Marketers who ignore it waste budget, while those who embrace it watch revenue climb. So how do you turn raw numbers into smarter ads, higher conversion rates, and happier customers?

Content authorArtem Lozinsky, EMBA, MScPublished onReading time8 min read

What You’ll Learn

Over the next few minutes, you’ll gain a practical understanding of how data-driven marketing turns raw information into competitive advantage. Specifically, you will discover:

  • Why data-driven decisions consistently sharpen performance KPIs, from lower CPA to higher customer lifetime value, while eliminating wasted spend and guesswork

  • Which marketing analytics metrics truly matter, and which ones deserve a permanent place on your dashboard versus those that only create noise

  • Step-by-step tactics for building dashboards that tell a clear performance story, enabling faster decisions instead of overwhelming teams with disconnected charts

  • Real-world company examples that demonstrate how data-first thinking leads to measurable revenue growth, stronger forecasts, and internal buy-in

By the end, you’ll be able to spot early performance signals before competitors do, respond with confidence rather than hesitation, and communicate ROI in clear, business-focused terms that resonate with leadership.

What is Data-Driven Marketing?

Data-driven marketing is a performance approach that uses accurate, timely data to shape targeting, creative, spend, and optimization so campaigns hit concrete KPIs like lower CPA, higher CLV, and faster revenue growth.

Why Data Matters to Performance KPIs

Most teams still trust gut feelings, yet 83 % of marketers now say data-driven marketing is vital to growth.

Smart use of numbers brings three immediate benefits:

  • Campaign efficiency: 72 % of marketers report tighter budget control when data guides choices

  • Personalization: Tailored messages lift conversion rates by 32 % on average

  • Faster learning loops: Real-time feedback lets you redirect ad spend mid-flight

A strong data practice also protects the bottom line. One in seven marketers lost money last year because of bad data, averaging $ 91 000 in direct costs.

Treat data as an asset with a measurable ROI, not a by-product of campaigns. Accurate inputs mean accurate decisions, which translate into healthier KPIs. Data is not a luxury. It is the guardrail that keeps performance marketing on track. For more detail on creating a system built around data, see How to Build a Performance Marketing Strategy That Scales.

Essential Marketing Analytics KPIs to Track

A customer analytics dashboard displaying customer lifetime value, repeat purchase rate, NPS score, and brand visibility compared to competitors

Before you build dashboards you need to agree on the scorecard. The following metrics cover the full customer journey.

Awareness Metrics

These metrics evaluate how widely your brand or campaign is exposed to potential customers at the top of the funnel.

Key awareness indicators include:

  • Impressions

  • Reach by unique users

  • Share of voice versus rivals

Awareness metrics measure visibility, not effectiveness. They answer a foundational question: Are we present in the market at all? While they don’t indicate intent or revenue, they are essential for diagnosing top-of-funnel issues and benchmarking brand presence against competitors.

Engagement Metrics

These metrics show how users interact with your content after they have been exposed to it.

Typical engagement signals are:

  • Click-through rate (CTR)

  • Time on page and scroll depth

  • Social interactions (likes, shares, comments)

Engagement metrics indicate relevance and message clarity. Strong engagement suggests that targeting and creative align with user intent, while weak engagement often highlights friction, unclear value propositions, or audience mismatch.

Conversion Metrics

These metrics determine whether marketing activity results in meaningful business actions.
Common conversion KPIs include:

  • Cost per acquisition (CPA)

  • Conversion rate by channel

  • Revenue per visitor

Conversion KPIs connect marketing spend directly to revenue and growth. They are critical for evaluating channel efficiency and avoiding optimization around vanity metrics.

Retention & Loyalty Metrics

These metrics assess the strength and longevity of customer relationships after the first conversion.
Long-term performance is reflected in:

  • Customer lifetime value (CLV)

  • Repeat purchase rate

  • Net promoter score (NPS)

Retention metrics reflect long-term value creation. Since retaining customers is typically more cost-efficient than acquiring new ones, these KPIs should be tracked with the same rigor as acquisition metrics.

Choose a handful from each bucket that match your goals. Fewer, clearer metrics beat sprawling spreadsheets every time.

Building an Actionable Dashboard

A dashboard should answer “Are we winning?” at a glance.

Step 1: Map Business Goals to Metrics

This step ensures your dashboard reflects business outcomes, not just marketing activity.
Key actions include:

  • Tie each campaign objective (e.g., lead generation) to one KPI (e.g., cost per lead).

  • Assign metric owners to prevent “dashboard drift.”

Step 2: Integrate Clean Data Sources

This step focuses on data quality, since unreliable inputs produce misleading insights.
Best practices include:

  • Set naming conventions for UTMs and ad sets.

  • Automate imports from ad platforms, CRM, and analytics suites.

  • Run weekly data hygiene checks to catch duplicates and anomalies.

Step 3: Visualize for Quick Insight

This step turns raw data into insights that can be understood in seconds.
Effective visualization techniques include:

  • Use line charts to spot trends, bar charts to compare segments, and gauges for goal progress.

  • Limit colors to two or three to avoid cognitive overload.

  • Include a plain-language note under each chart explaining “What changed” and “Why it matters.”

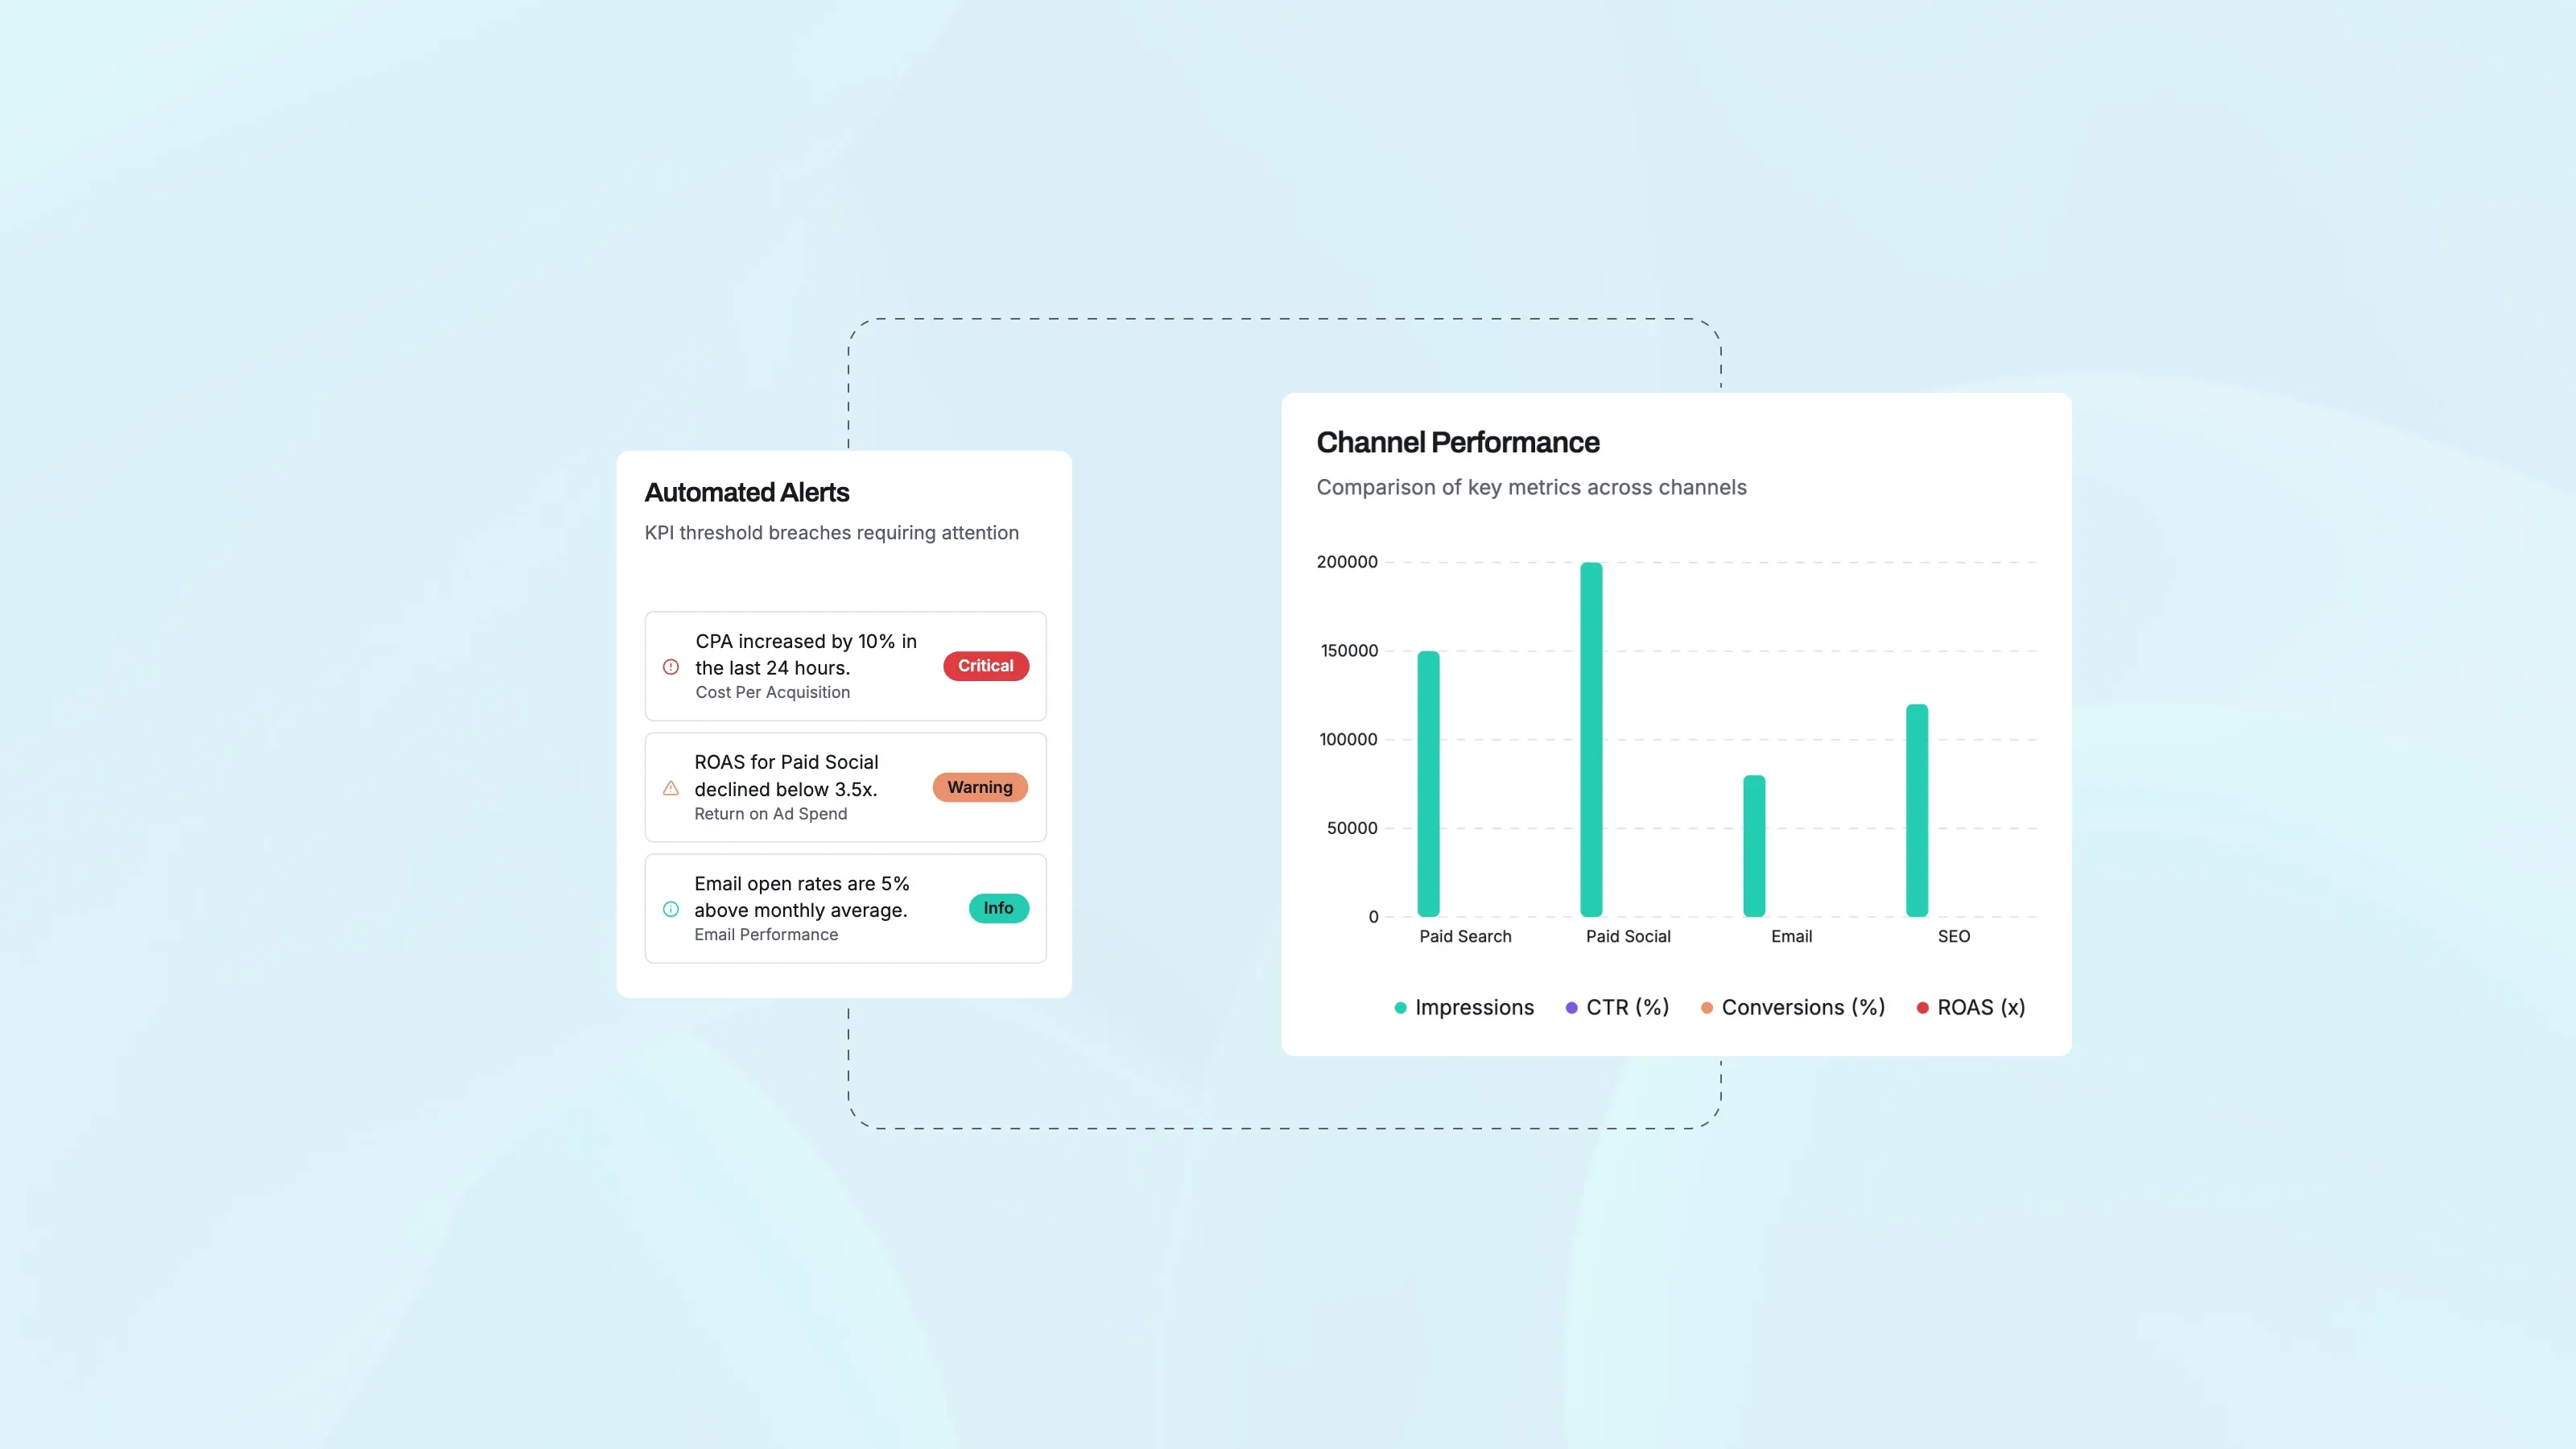
Step 4: Automate Alerts

This step ensures critical changes are acted on before they become costly.
Common automation methods include:

  • Trigger Slack or email notifications when KPIs cross tolerance bands.

  • Schedule snapshot PDFs for executives who prefer their inbox.

For additional inspiration and concrete practices to turn dashboards into growth engines, read AI-Powered Marketing: How to Use Artificial Intelligence for Better Results.

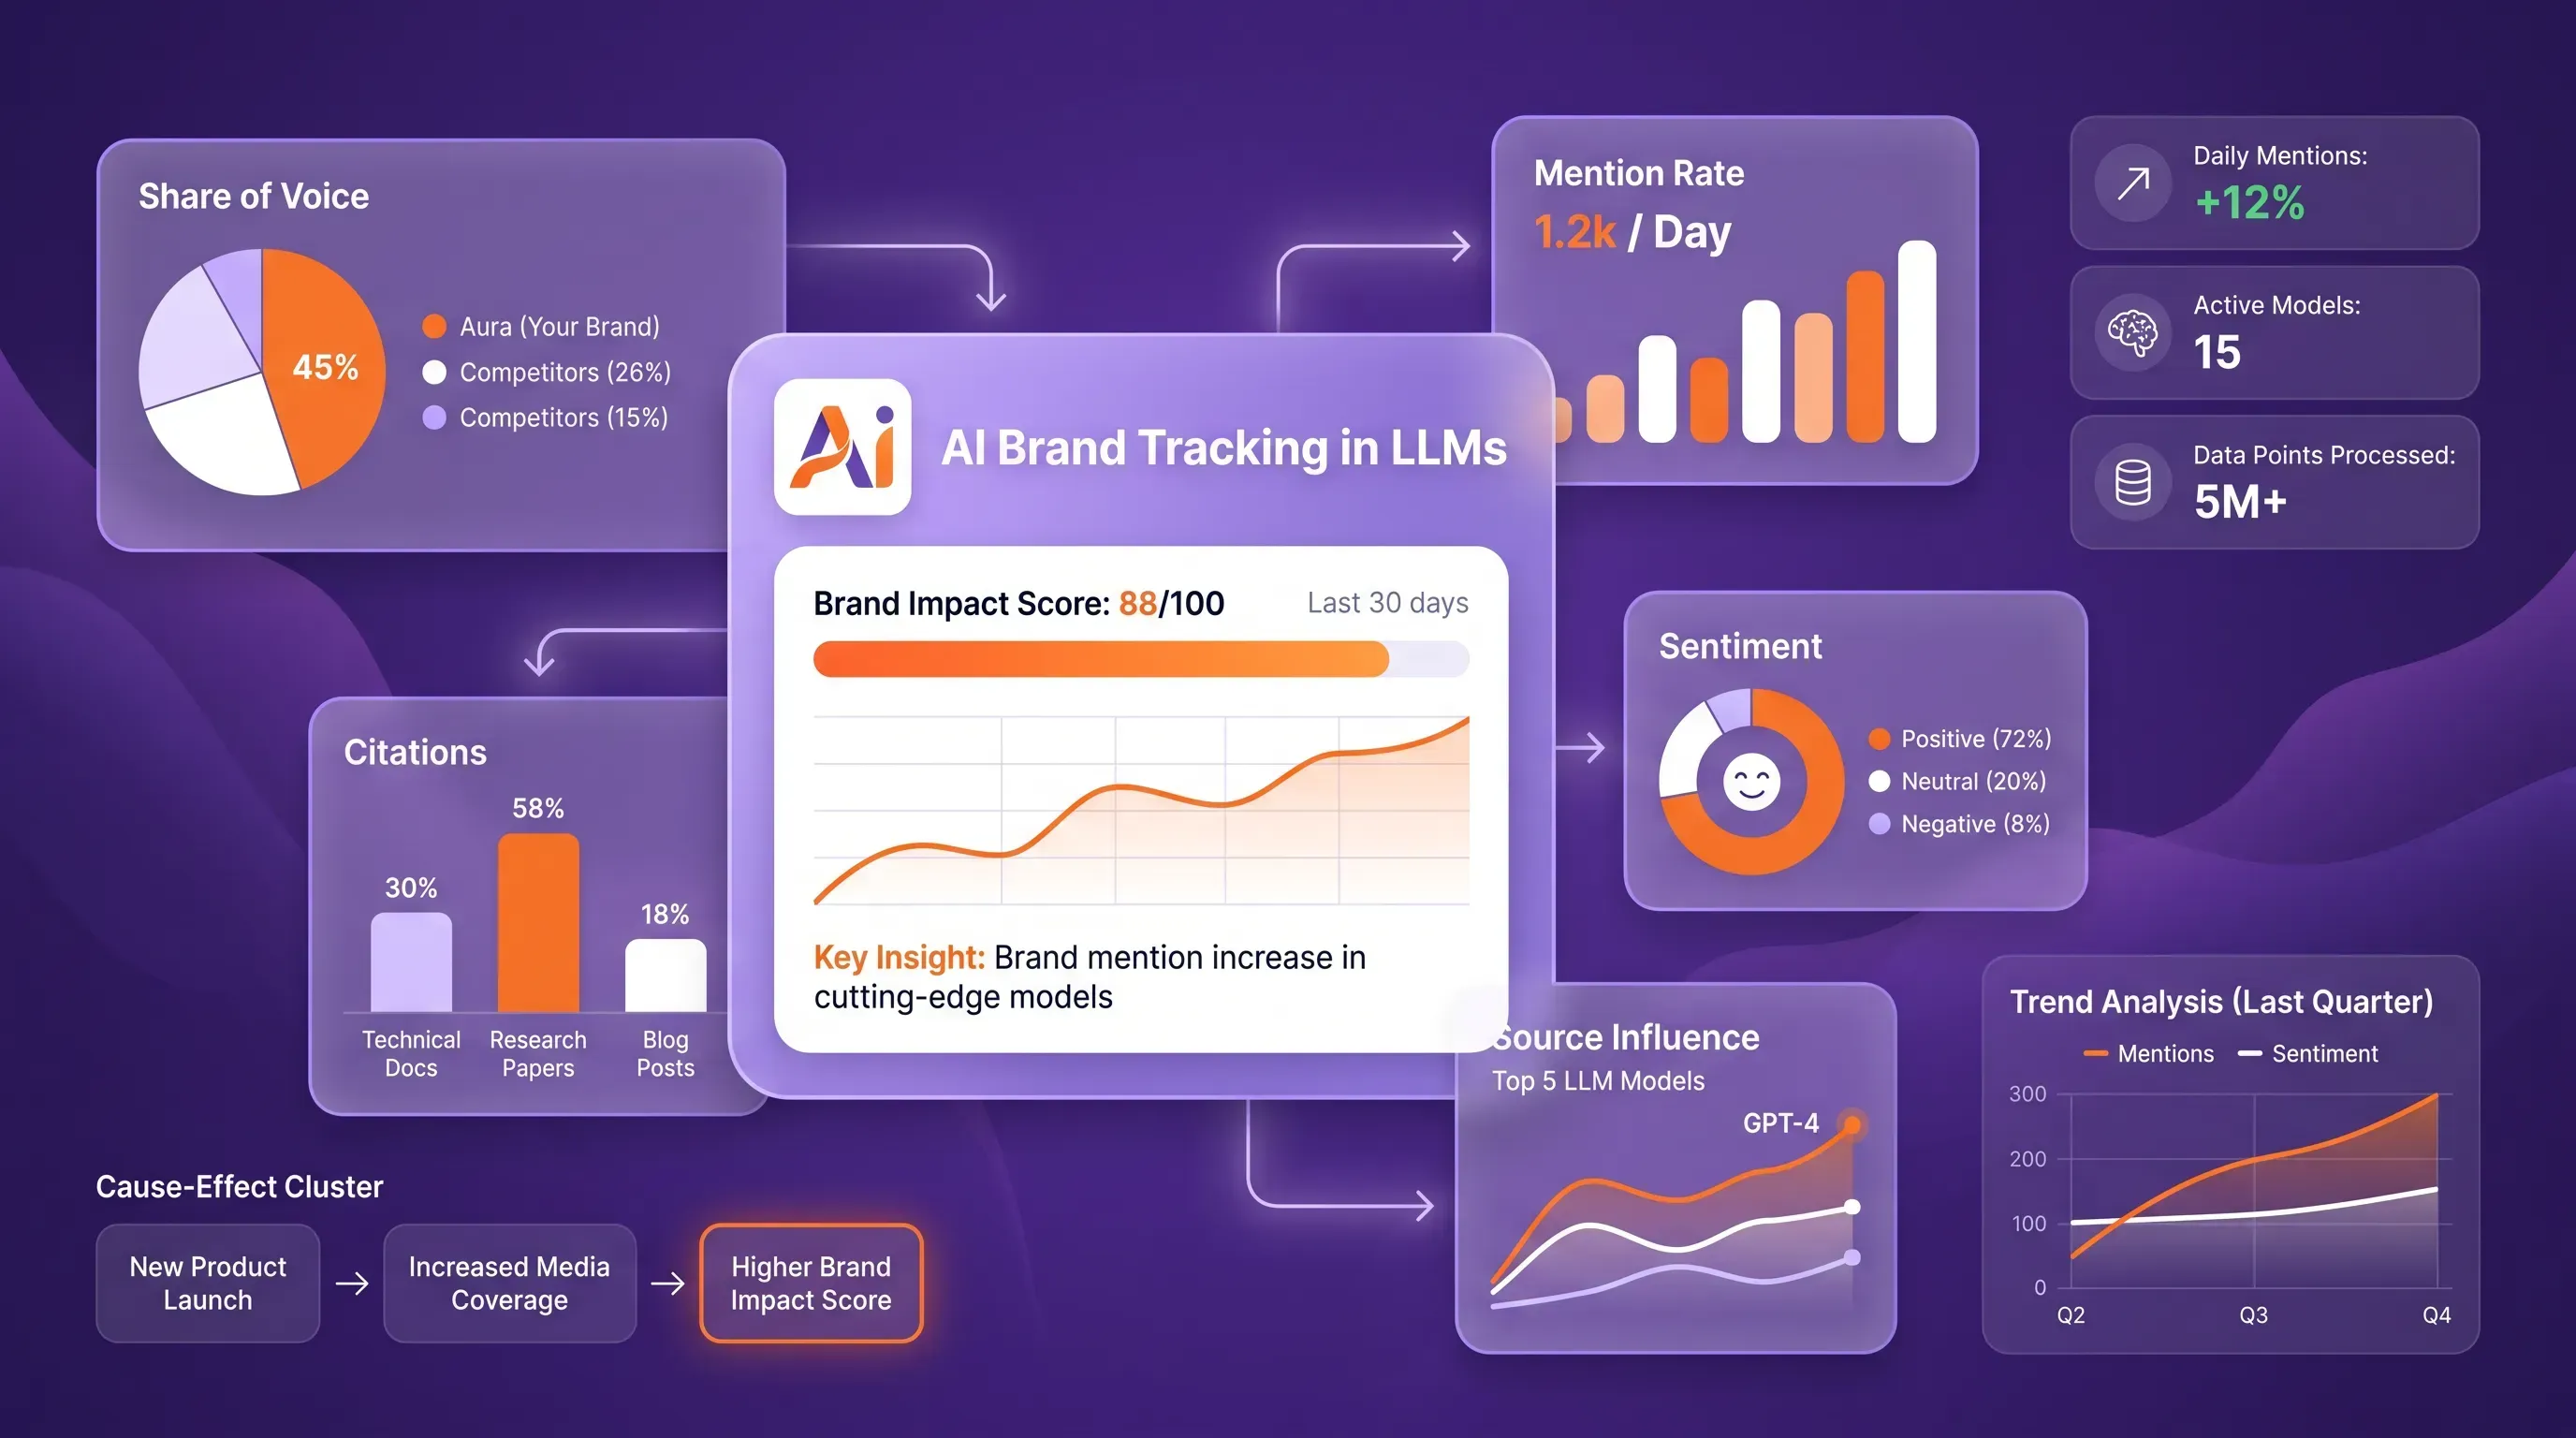
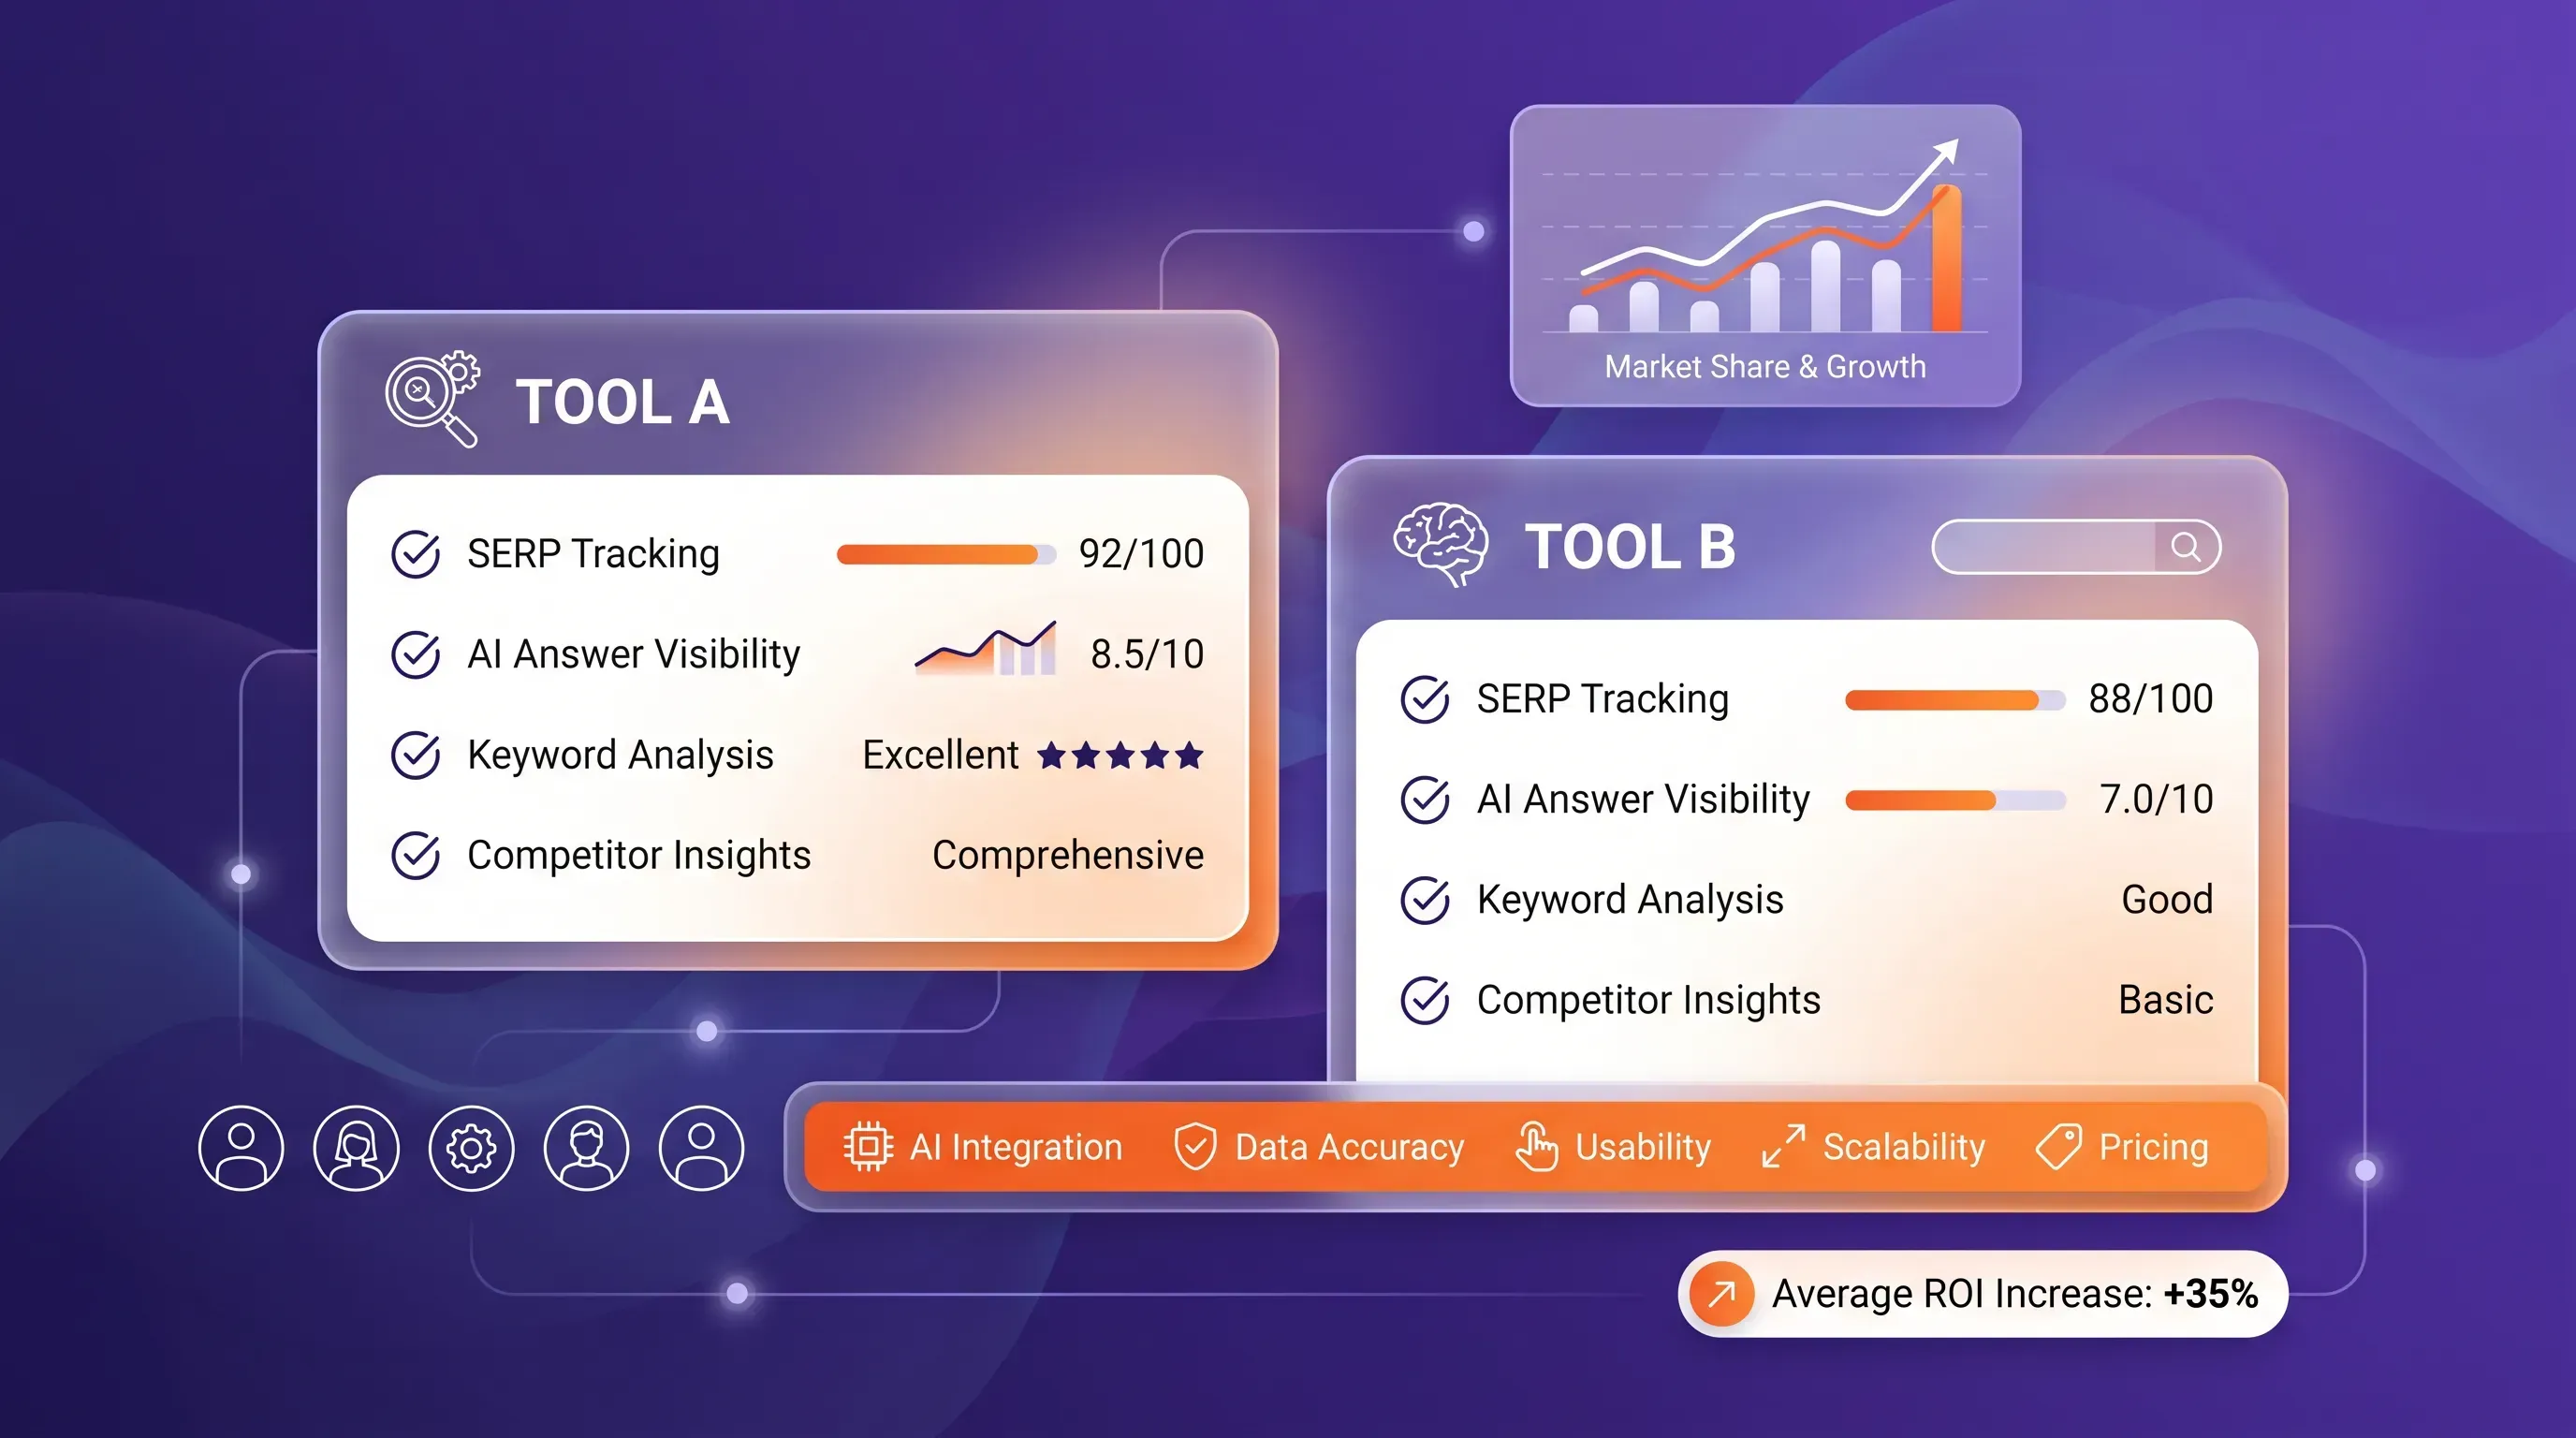
Modern tools such as Looker Studio and Power BI accelerate dashboard creation, while AI-driven platforms like Snoika go a step further by tracking brand visibility inside AI-generated answers, offering insight beyond traditional analytics.

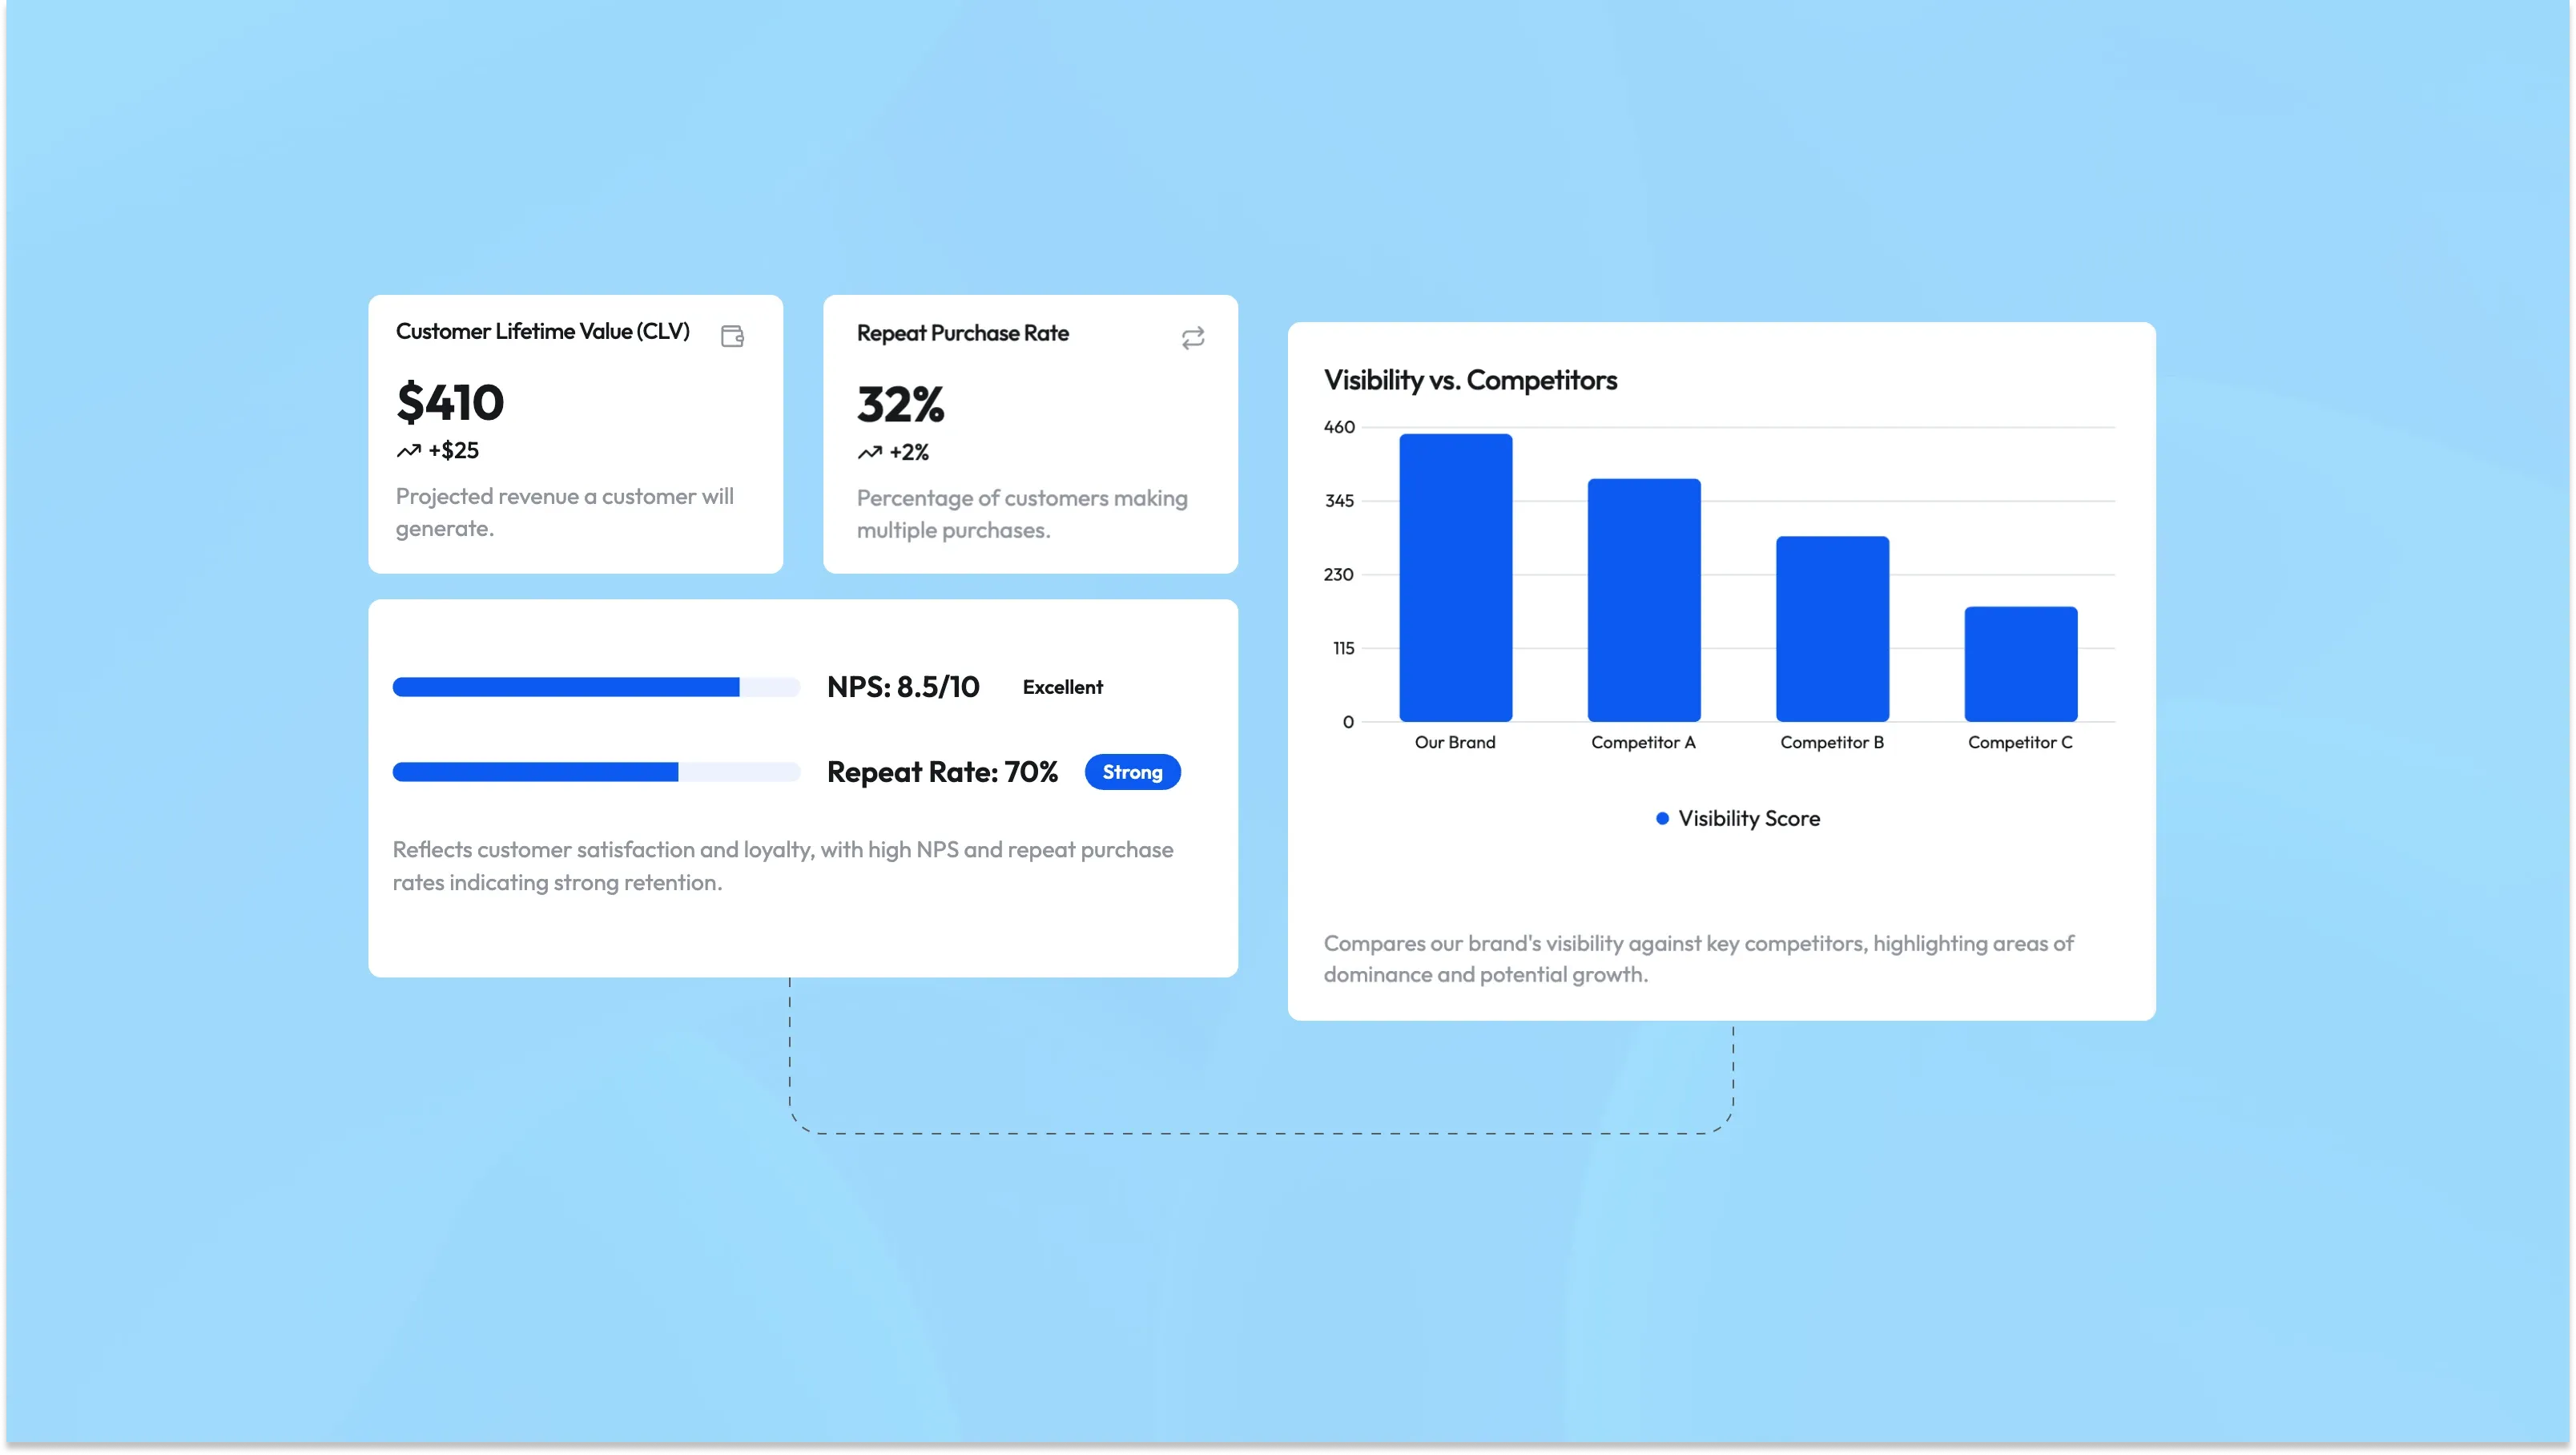
Ultimately, a dashboard succeeds when anyone, from intern to CMO, can tell within 30 seconds whether performance calls for celebration or a strategic pivot.

Real-World Success Stories

Stories bring data to life by showing how analytics translate into concrete business decisions. The following examples illustrate how disciplined measurement leads directly to better outcomes.

Case Study: SaaS Lead Gen

A mid-size SaaS company began reallocating ad spend on a weekly basis using a live CLV-to-CPA ratio instead of static budget caps. By continuously shifting budget toward channels with the highest projected lifetime value, the company aligned marketing spend more closely with revenue potential.

After three months:

  • CPA dropped 28 %

  • Sales pipeline grew 19 %

  • Finance approved a 15 % budget increase because ROI was clearly documented

Case Study: Retail Personalization

An online retailer combined browsing behavior with historical purchase data to create granular micro-segments. Campaigns were then personalized at the segment level rather than broadcast to broad audiences, improving relevance and timing.

As a result:

  • Email open rates rose from 18 % to 27 %

  • Average order value climbed 12 %

  • Stockouts fell because demand forecasts became more accurate

If you're interested in more examples, see how Marketing Agencies: Scale Your SEO Strategy with Snoika showcases data-driven wins across industries.

Together, these cases show that analytics only create value when they guide action. The common pattern is clear: small, frequent experiments paired with real-time feedback consistently outperform large, infrequent campaign launches.

Common Data Pitfalls and Fixes

Even experienced teams stumble when analytics processes scale faster than alignment.

The following pitfalls appear most often, and are preventable with clear ownership and discipline:

  • Siloed data: Marketing, sales, and product teams work from disconnected dashboards, leading to conflicting conclusions.
    Fix: Establish a single source of truth, typically a centralized data warehouse shared across teams.

  • Vanity metrics: Teams optimize for visibility metrics such as followers or impressions instead of profitability.
    Fix: Prioritize KPIs that tie directly to revenue, margin, or customer lifetime value.

  • Analysis paralysis: Teams generate endless reports but delay decisions waiting for perfect certainty.
    Fix: Define decision deadlines and act once roughly 70 % confidence is reached.

  • Poor data quality: Inaccurate or inconsistent data silently erodes trust and wastes budget.
    Fix: Implement quarterly audits, validation rules, and clearly assigned data owners.

For more actionable tips on aligning team culture and process to prevent these pitfalls, review How to Choose the Best Marketing Agency for Your Brand in 7 Streamlined Steps.

Spot these issues early and your data will stay an asset, not a liability.

Conclusion

Performance marketing without data is little more than educated guesswork. By choosing the right KPIs, visualizing them with clarity, and acting on insights in near real time, teams can systematically improve efficiency, personalize campaigns at scale, and unlock sustainable revenue growth.

The most successful organizations treat data as a living asset rather than a static report; investing in its quality, governance, and accessibility so it can guide every campaign decision.For a deeper dive into predictive analytics and leveraging AI to optimize your spend, see AI-Powered Marketing: How to Use Artificial Intelligence for Better Results.

Traditional marketing often relies on intuition and historical norms, while data-driven marketing bases every decision on measurable evidence, from audience selection to creative tweaks. The result is faster learning and stronger ROI.

Google Analytics 4, Looker Studio, and free CRM dashboards offer a gentle learning curve. As complexity grows, consider Power BI, Tableau, or specialized AI visibility platforms such as Snoika.

High-velocity channels like paid search warrant daily checks. Brand campaigns might be fine with weekly reviews. The rule of thumb is to review often enough to correct mistakes before they burn budget.

Yes. Many analytics tools have free tiers, and even simple A/B testing can produce meaningful gains. Start small, focus on one or two KPIs, and expand as wins accumulate.

The most common mistake is tracking too many metrics without a clear goal. Effective data-driven marketing focuses on a small set of KPIs directly tied to business outcomes.

Schedule a Meeting

Book a time that works best for you

You Might Also Like

Discover more insights and articles

Dashboard comparing performance marketing and growth marketing channels with a decision scorecard and real-world retail DTC case insights

Performance Marketing vs. Growth Marketing: Key Differences

Performance marketing vs growth marketing confuses even seasoned CMOs. Which model moves the revenue needle faster, and which builds durable momentum? Let’s break down the essentials so you can choose the right approach without second-guessing every campaign.

Performance marketing dashboard showing channel ROI comparison, A/B testing results, smart bidding automation, and AI-driven campaign optimization

How to Build a Performance Marketing Strategy That Scales

Performance marketing promises measurable growth, yet many teams still guess which ads, channels, or creatives actually work. Ready to stop guessing and start seeing the numbers you need?

A modern performance marketing strategy lets you spend every dollar where it matters, adjust quickly, and keep climbing. This guide shows you how.

An AI content marketing trends dashboard highlighting AI search visibility, emerging content creation trends, ethical governance guardrails, and higher ROI reported by businesses using AI for content and SEO

The Future of AI in Content Marketing: What’s Next?

Artificial intelligence is no longer a futuristic concept, it is the beating heart of modern content programs. Marketers who ignore the shift risk fading from search results, social feeds, and customer conversations.

In this article, you will see how AI already fuels content, where the technology is heading, and the guardrails every brand needs. Real case studies, crisp stats, and practical tips keep things grounded and easy to apply.

An AI content marketing dashboard showing top-performing content by questions answered, organic traffic growth, and improved local SEO visibility through a case study

Top Search Optimization Strategies for Small Businesses

Small businesses fight for the same digital shelf space as national brands, yet they rarely have the same budgets. The good news: precise search optimization levels the playing field and helps local firms reach people who are ready to buy.

Below is a clear, field-tested roadmap that shows how to boost visibility, win local customers, and grow authority without wasting a cent.