
Reduce customer acquisition cost with AI search
You reduce customer acquisition cost with AI search when ChatGPT and Google AI Overviews mention and cite your brand in the answers buyers read before they shortlist vendors. Paid ads charge you for every visit. A page that AI assistants cite keeps sending prospects for months after you publish it, so its cost is spread across more customers each quarter. Those prospects also arrive further along in their research, which brings your blended cost per customer down.
 Denys SuliatytskyiHead of Growth, Snoika · 8 min read





















How AI search lowers CAC
AI search lowers CAC by cutting what you pay to reach a prospect and raising the share of prospects who buy. Customer acquisition cost (CAC) is total sales and marketing spend divided by new customers in the same period. You lower CAC when you spend less to win each customer or win more customers for the same spend.
Semrush research found the average AI search visitor is 4.4 times as valuable as a traditional organic visitor when measured by conversion rate. The assistant has already compared the options for the buyer, so they reach your site ready to decide. At DevDay in October 2025, Sam Altman, CEO of OpenAI, said, "More than 800 million people use ChatGPT every week."
A niche B2B product with few strong competitors can win the answer quickly, while a crowded horizontal category takes longer. 3DPrinterOS achieved #1 visibility in ChatGPT for industry-specific queries and turned AI search into a steady inbound lead source of 3–4 qualified inbound leads/day. Before you commit budget, check whether buyers ask AI assistants the questions your product answers.
Why paid CAC keeps rising
Paid CAC keeps rising because more advertisers bid for the same clicks while fewer searchers click at all. WordStream's analysis of 16,000 US Google Ads campaigns found the average cost per click rose 12.88% in 2025, and 87% of industries paid more per click than the year before. As those increases compound, a campaign that broke even in 2023 can lose money in 2025 with no change to its targeting.
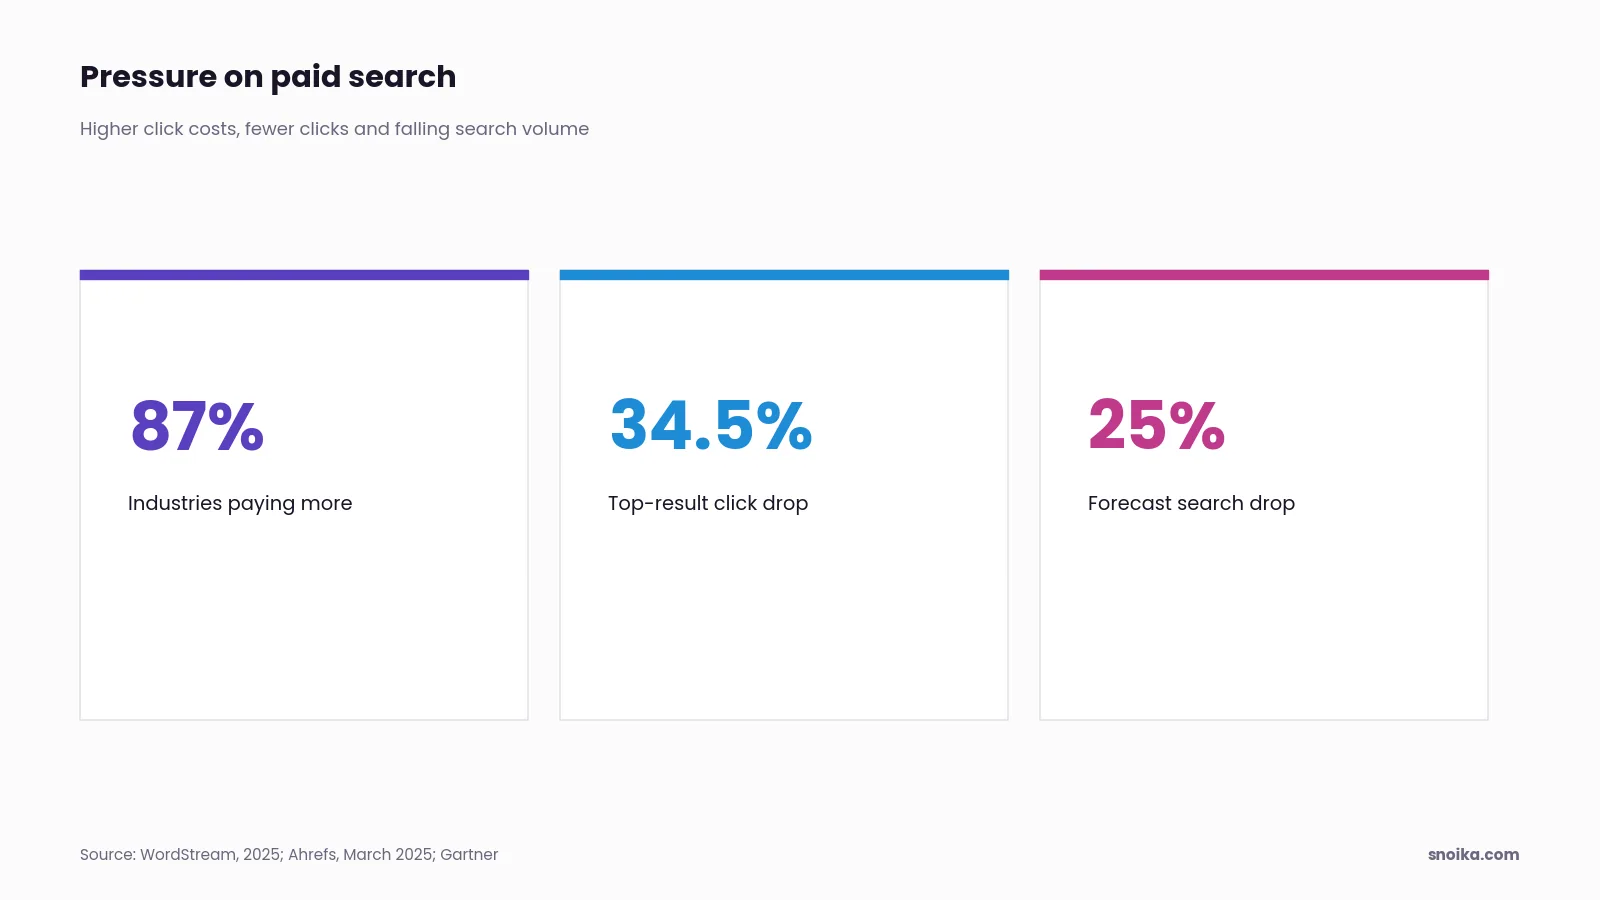
Ahrefs measured a 34.5% lower click-through rate for the top-ranking page when a Google AI Overview appeared, according to its March 2025 data. Alan Antin, Vice President Analyst at Gartner, put the shift this way: "Generative AI (GenAI) solutions are becoming substitute answer engines, replacing user queries that previously may have been executed in traditional search engines." Gartner's forecast states that traditional search volume will drop 25% by 2026.
Each click costs more, and buyers who once clicked an ad now read an AI answer instead. Check your own Google Ads account for both trends over the last 24 months before you blame creative or targeting.
Visibility vs paid spend
AI search visibility lowers CAC differently from paid ads because you pay for it once per page, while paid ads charge for every visit for as long as the campaign runs. When you switch off an ad budget, leads stop the same day. A cited page keeps earning answers until a competitor's content displaces it. Paid cost per lead stays flat, while the cost per lead from visibility falls over time.
The table below compares the options a SaaS team weighs when it moves budget toward AI search, on the same attributes.
| Option | What you pay for | What happens when spend stops | Price (2025 to 2026) | Who it suits |
|---|---|---|---|---|
| Paid search ads | Every click | Leads stop at once | Average Google Ads CPC of $5.26 in 2025 | Teams that need pipeline this month |
| SEO or content agency | Retainer or project hours | Published pages keep working, but output stops | Quoted per scope | Teams with budget but no writers |
| In-house content team | Salaries and tools | Pages keep working, but output stops | Fully loaded headcount cost | Companies with steady volume and an editor to lead it |
| Monitoring-only tool | Software seat | Reports stop, content is unaffected | Varies by vendor | Teams with writers who only lack data |
| Snoika | Weekly plan covering tracking and content | Published pages stay on your domain | Plans on the pricing page | Teams that want tracking and publishing in one place |
Paid search ads
- What you pay for
- Every click
- What happens when spend stops
- Leads stop at once
- Price (2025 to 2026)
- Average Google Ads CPC of $5.26 in 2025
- Who it suits
- Teams that need pipeline this month
SEO or content agency
- What you pay for
- Retainer or project hours
- What happens when spend stops
- Published pages keep working, but output stops
- Price (2025 to 2026)
- Quoted per scope
- Who it suits
- Teams with budget but no writers
In-house content team
- What you pay for
- Salaries and tools
- What happens when spend stops
- Pages keep working, but output stops
- Price (2025 to 2026)
- Fully loaded headcount cost
- Who it suits
- Companies with steady volume and an editor to lead it
Monitoring-only tool
- What you pay for
- Software seat
- What happens when spend stops
- Reports stop, content is unaffected
- Price (2025 to 2026)
- Varies by vendor
- Who it suits
- Teams with writers who only lack data
Snoika
- What you pay for
- Weekly plan covering tracking and content
- What happens when spend stops
- Published pages stay on your domain
- Price (2025 to 2026)
- Plans on the pricing page
- Who it suits
- Teams that want tracking and publishing in one place
Snoika is an all-in-one platform for SEO and GEO with AEO support. It audits websites and builds researched content maps. It tracks brand visibility in Google and AI assistants. It also publishes content and builds AI-ready websites, and the same team runs both the platform and the services, with human review on top of automated workflows. Keep paid ads running if you need deals within a quarter. Start shifting budget toward visibility once paid CAC passes your payback target. A monitoring-only tool is enough if you already employ strong writers.
Measuring the CAC shift
You measure organic search's impact on CAC by splitting CAC by channel and assigning content costs to the organic channel. Then you compare cohorts over time. Blended CAC alone hides the effect, because a cheap organic customer and an expensive paid customer average out. Apply the same formula to each channel, so $50,000 spend divided by 200 new customers gives a $250 CAC.
- Set a baseline. Calculate blended CAC and paid CAC for the last 4 quarters. Pull your spend from finance. Count new customers in your CRM.
- Tag every source. Label customers from ads or organic search as paid or organic search. Use AI referral or direct for customers from those sources. Your source field in the CRM has to match what GA4 reports.
- Load the organic costs. Add content production, tools and the staff hours spent on search to the organic channel. Teams that leave these out make organic look free, and the comparison falls apart in the first budget review.
- Compare cohorts. Measure CAC per channel each quarter. Organic CAC falls as the same pages keep converting with no new spend.
- Watch blended CAC and payback. With total spend flat, the shift shows up as growth in organic's share of new customers alongside a drop in blended CAC.
Paid changes show up within weeks, but organic and AI visibility take a quarter or more to affect CAC. Judge AI search ROI on 2 full quarters of data.
The LTV to CAC ratio
A good LTV to CAC ratio for B2B SaaS is 3:1 at minimum, and 4:1 or higher marks a healthy business. Lifetime value (LTV) is the revenue or gross profit a customer brings over the whole relationship. At 3:1 you spend a third of that value to win the customer. First Page Sage puts the B2B SaaS benchmark at 4:1, from $956 LTV against a $239 CAC.
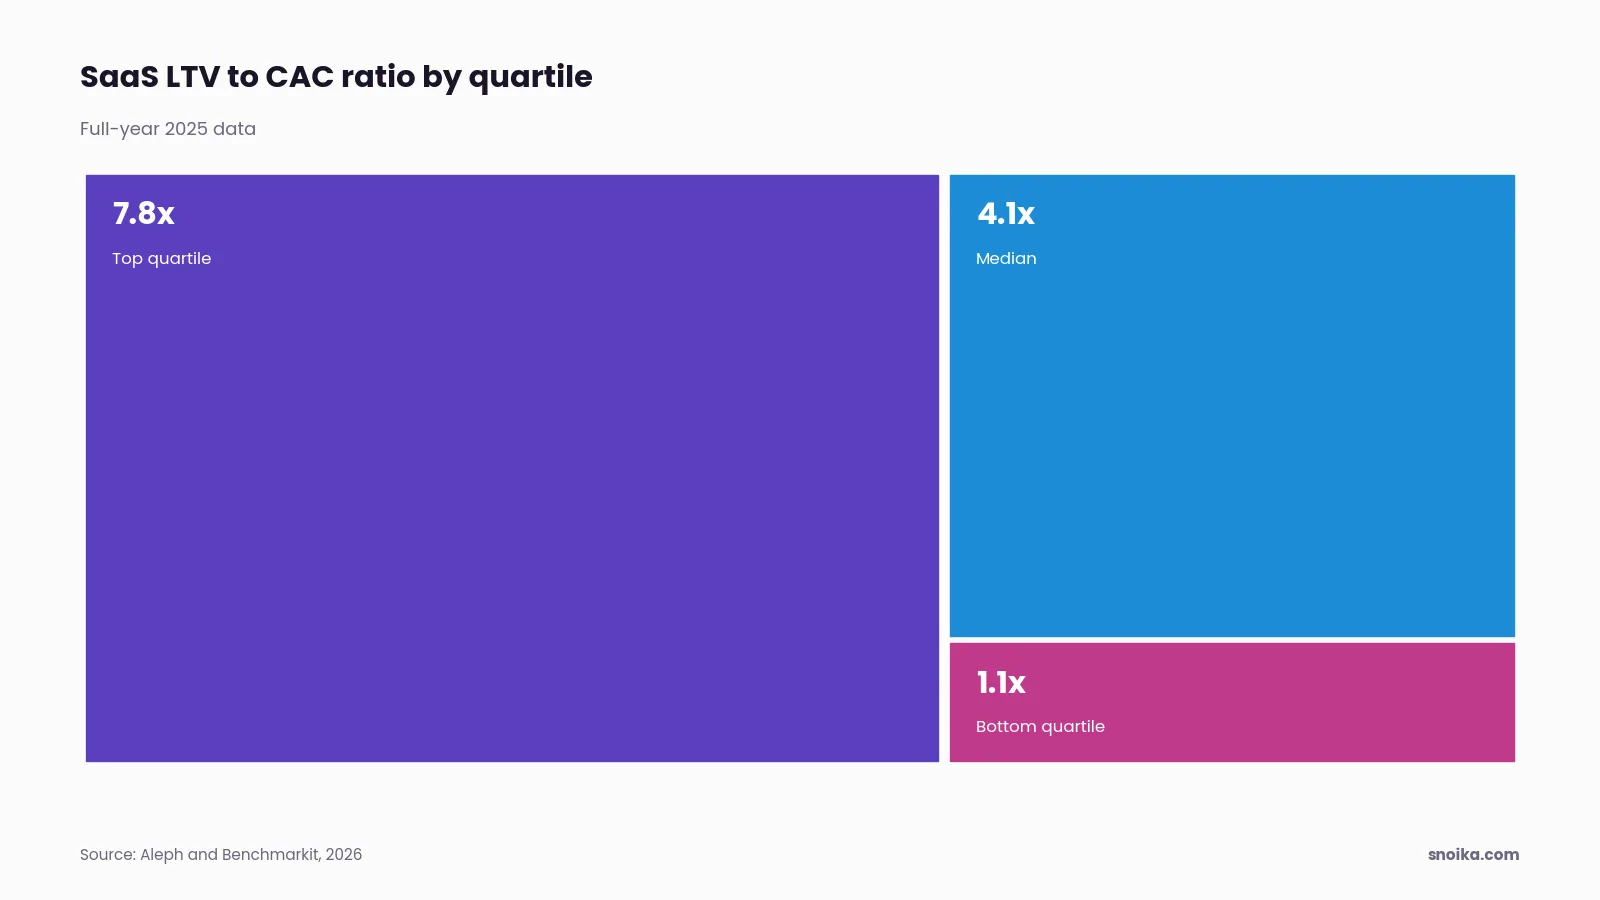
Assess LTV to CAC benchmarks against your company's stage. The 2026 Aleph and Benchmarkit report, built on full-year 2025 data, found a median ratio of 4.1x. The top quartile was at 7.8x and the bottom quartile at 1.1x. The same report identifies ratios above about 8x as a sign of underinvestment in growth, while ratios below 3:1 mean every new customer ties up cash for too long.
Check the ratio by channel as well as blended. First Page Sage reports that SaaS companies aim higher on organic channels such as SEO and email, because those channels reward thoughtful work more than budget. And if your LTV figure rests on a 5-year lifespan projected from 6 months of data, treat the ratio as a guess.
B2B SaaS CAC benchmarks
B2B SaaS CAC benchmarks run from about $200 to over $1,900 per customer because datasets and cost definitions differ. One study counts only marketing spend, while another loads in sales salaries. Compare your number with the benchmark whose method matches yours.
| Metric | Benchmark | Source and period |
|---|---|---|
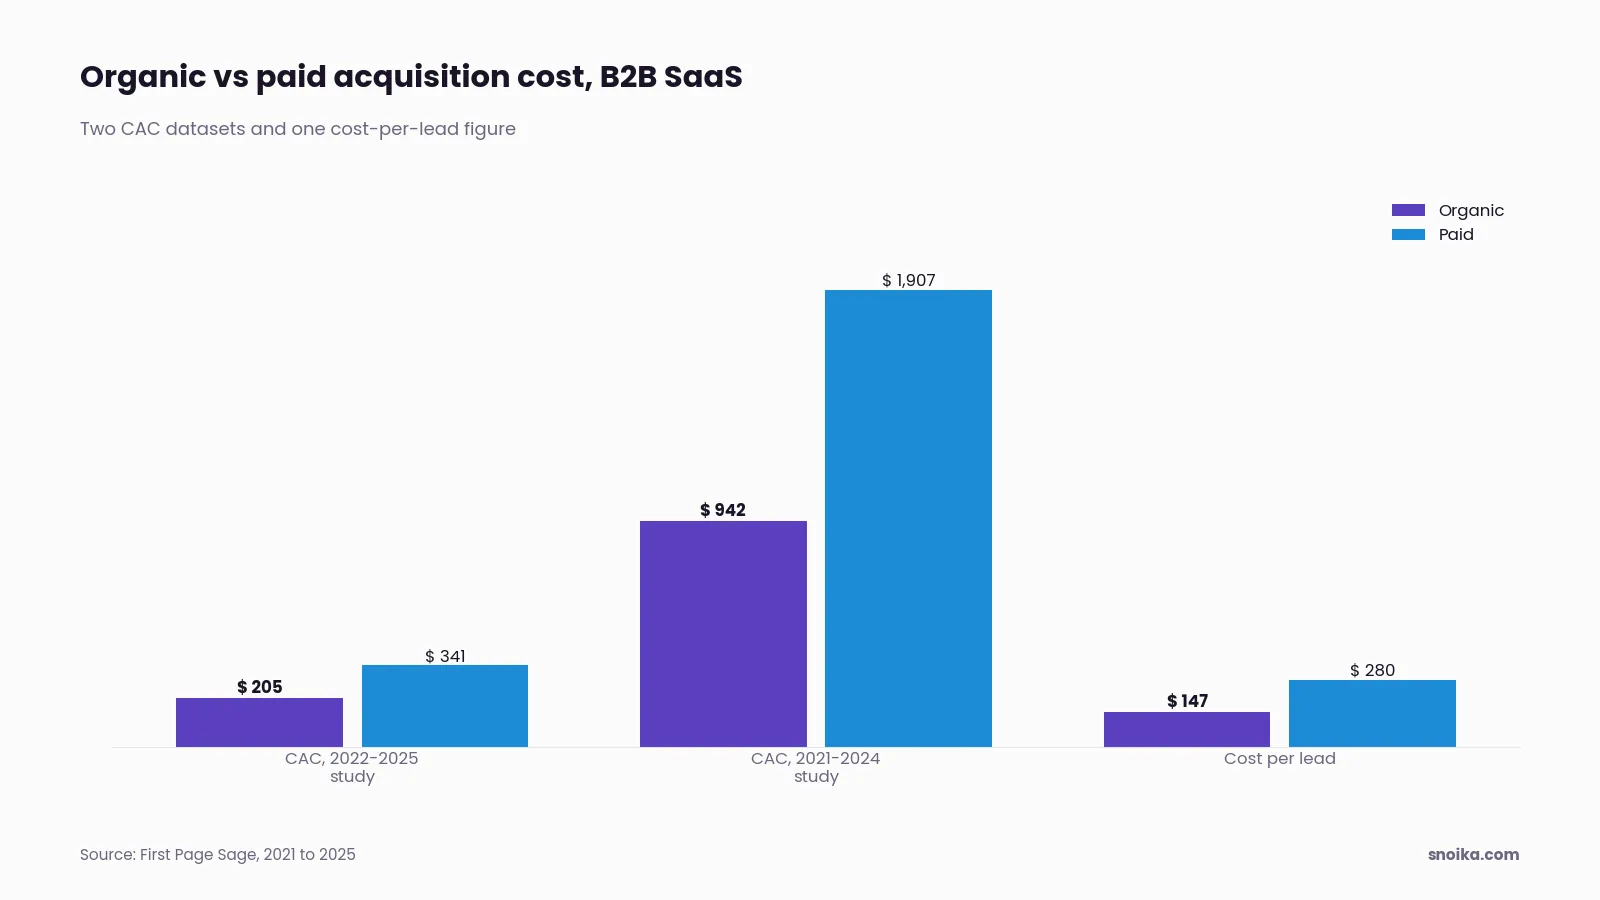
| Blended B2B SaaS CAC | $239 blended CAC, with $205 organic and $341 paid | First Page Sage, 2022 to 2025, US |
| Average B2B CAC by channel | $942 organic CAC against $1,907 paid | First Page Sage, 2021 to 2024, US |
| Average CAC from GEO work | $559 GEO CAC in Q2 2025, down from $2,134 in Q4 2023 | First Page Sage, 127 B2B companies |
| Cost per lead | $147 organic lead against $280 paid | First Page Sage SaaS Benchmarks 2025 |
| New CAC ratio | $2.00 per $1 of new customer ARR, up 14% in 2024 | Benchmarkit 2025 |
| Median CAC payback | 16 months in 2025, down from 18 in 2024 | Aleph and Benchmarkit 2026 |
Blended B2B SaaS CAC
- Benchmark
- $239 blended CAC, with $205 organic and $341 paid
- Source and period
- First Page Sage, 2022 to 2025, US
Average B2B CAC by channel
- Benchmark
- $942 organic CAC against $1,907 paid
- Source and period
- First Page Sage, 2021 to 2024, US
Average CAC from GEO work
- Benchmark
- $559 GEO CAC in Q2 2025, down from $2,134 in Q4 2023
- Source and period
- First Page Sage, 127 B2B companies
Cost per lead
- Benchmark
- $147 organic lead against $280 paid
- Source and period
- First Page Sage SaaS Benchmarks 2025
New CAC ratio
- Benchmark
- $2.00 per $1 of new customer ARR, up 14% in 2024
- Source and period
- Benchmarkit 2025
Median CAC payback
- Benchmark
- 16 months in 2025, down from 18 in 2024
- Source and period
- Aleph and Benchmarkit 2026
Look at the gap between organic and paid in each row. Across 3 separate First Page Sage datasets, organic costs roughly half of what paid costs. The new CAC ratio matters most if you report to investors, because it ties spend to annual recurring revenue (ARR) instead of to customer count.
Building compounding organic presence
Organic presence compounds because each page you publish keeps earning visits and citations while your cost for it stays fixed. Ten pages cited in AI answers bring leads in month 12 that you paid for in month 1. Paid spend never builds up this way. Start with the questions buyers ask before they buy. Then answer each one on a page an assistant can quote.
A page on your own domain builds authority for your brand, while a page on a rented platform builds authority for that platform. Snoika uses a DNS connection to publish on the client's own domain. It needs no migration and works on any CMS, and the client approves every page in the dashboard before it goes live. Agrello, in e-signature, saw +125.6% organic search sessions YoY and generated 51.8K impressions from Snoika-created pages.
Markets outside English are cheaper to win, because fewer competitors publish in Estonian or Portuguese. Snoika creates content in 135+ languages and regional variants.
Ahrefs found that a Google AI Overview has a 70% chance of changing between observations, and 45.5% of cited sources are new each time. So refresh your top pages on a schedule, and check them again whenever visibility drops.
Tracking AI-sourced leads
To track AI-sourced leads, combine referral data with buyer self-reporting, then compare those records with visibility checks at the prompt level. Each source captures only part of the picture. ChatGPT sends some visits with a referrer you can see. Other buyers read the answer and then type your URL directly. So treat each AI attribution method as a partial count, and compare them with each other.
Separate AI referrals in GA4
Create a custom channel group in Google Analytics 4 (GA4) for referrals from chatgpt.com and other assistant domains. Put the rule above the default referral channel so these visits don't merge into it. Then map the channel to your CRM source field, so a lead from ChatGPT carries that label through to closed revenue.
Add a self-reported source field
Add an open "How did you hear about us?" field to your demo form. Buyers who found you in an AI answer write "ChatGPT" there, even when GA4 logged the visit as direct. Self-reported attribution explains a rise in direct traffic while paid traffic stays flat.
Track visibility at the prompt level
Run a fixed set of buyer prompts every week and record whether your brand appears. Snoika uses weekly prompt sets to track mentions and share of voice in ChatGPT and Google AI Overviews, where most AI search traffic happens. It also tracks sentiment and citations in those answers. Prompt data leads revenue data by weeks. 1StopVAT, in tax and fintech, saw 10x growth in ChatGPT visibility in 7 weeks. Watch for a gap between the two numbers. If visibility rises and leads don't follow, your pages are being cited for questions buyers ask too early in their research.
What to do next
Work out your organic and paid CAC as two separate numbers before you change a budget line. If paid CAC is above your payback target, move part of that budget into AI search visibility. Then give it 2 quarters before you judge it, because the savings grow over time. Every Snoika engagement starts with onboarding. We learn about your category and buyers, then discuss your goals. We ask for access to GA4 and Google Search Console. We also ask for access to Google Tag Manager. To scope it for your product, talk to an AI search expert.
FAQ
AI search can help reduce customer acquisition cost because cited pages keep attracting prospects after publication. Paid ads charge for each visit, while a page's production cost spreads across more customers as it continues converting. Buyers arriving from AI answers may also be further along in their research.
Divide organic acquisition spending by new customers attributed to that channel, then compare quarterly cohorts. Include content costs and search-related overhead so organic doesn't appear free. Track AI referrals separately, using consistent source labels in analytics and your customer records.
For B2B SaaS, aim for CAC:LTV of 1:3 or lower, equivalent to LTV:CAC of 3:1 or higher. A 1:4 ratio indicates healthier economics, but assess it against your company's stage. Treat ratios based on limited customer history as estimates.
Judge the change after two full quarters of data, since organic and AI visibility take a quarter or more to affect CAC. Compare channel-level CAC against your baseline, then check whether organic's share of new customers grows while blended CAC falls.
Your pages may be appearing for questions buyers ask too early in their research, or leads may take longer to appear. Check which questions generate mentions and prioritize pages answering buying-stage questions. Compare referral records with buyers' self-reported sources to identify visits recorded as direct traffic.